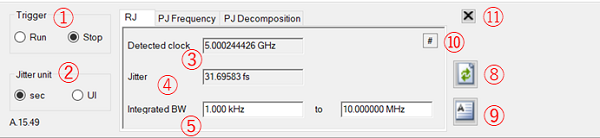
Select RJ from the analysis function selection tabs (default)
Follow these steps to start up the program.
If the Phase Noise measurement class is not selected, press Meas > Meas Class... > Phase Noise.
Press Macro > Macro 1 > Clock jitter analysis.
Note: When the macro button is not available, execute “C:\Program Files\Keysight\Network Analyzer\kjitterapp.exe”
It is required to push the button 11 in Screen for random jitter analysis to end the program. The measurement state before the Clock Jitter Application will be recalled.
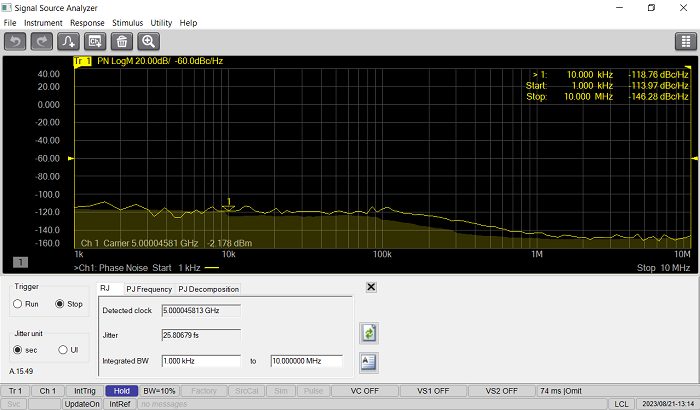
This analysis displays the clock frequency and the rms value of random jitter in phase-noise measurement. You can use the band marker on the screen to specify an analysis range. In this case, the analysis range is also displayed.
Note: If you select another analysis function tab (PJ Frequency/PJ Decomposition) during measurement, the current measurement is aborted. In this case, the # sign (10 in Screen) is displayed for the analysis result to indicate a possible mismatch of displayed information between the E505xA and Macro application.
When you want to specify an analysis range, it is required to change the value of the integrated BW (5 in Screen for random jitter analysis).
Select a jitter display unit (2 in Screen for random jitter analysis).
Button |
Function |
sec |
Displays data in the unit of second. |
UI |
Displays data in the unit of unit interval. |
Select the RUN button (1 in Screen for random jitter analysis).
The measurement starts, and the clock frequency (3 in Screen for random jitter analysis) and the random jitter rms value (4 in Screen for random jitter analysis) are displayed.
Click the STOP button (1 in Screen for random jitter analysis) to finish the measurement.
The maximum and minimum frequency (5 in Screen for random jitter analysis) can be set using this macro application. This setting does not change even by changing tabs (i.e. From Frequency tab to Decomposition tab or vica-versa), but once exiting the macro, it is initialized.
You can save the analysis result to a file by following the steps below.
Click the tab of the analysis result that you want to save. At this time, analysis is carried out once.
Use the Save/Recall function to save the analysis result. For details, refer to Save and Recall Files.
You can recall the analysis result from a file by following the steps below.
Use the Save/Recall function. For details, refer to Save and Recall Files
Press the Refresh button (8 in Screen for random jitter analysis).
You can save the result of random jitter analysis to a text file by pressing the Export button (9 in Screen for random jitter analysis) .
Pressing the Export button opens the analysis result file in the Notepad application. Pressing this button during measurement writes the analysis result displayed at that time.
This analysis displays the clock frequency and the RMS value of the periodic jitter when the spurious power value display is enabled in phase-noise measurement. You can use the band marker on the screen to specify an analysis range.
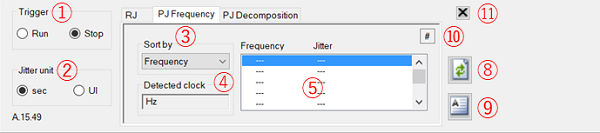
Select PJ Frequency from the analysis function selection tabs.
When you want to specify an analysis range, use the band marker on the phase-noise measurement screen.
Select a spurious sorting method displayed on the phase-noise measurement screen (3 in Screen for periodic jitter frequency analysis).
Button |
Function |
Jitter |
Sorts jitters in ascending order. |
Frequency |
Sorts frequencies in ascending order. |
Select a display unit (2 in Screen
for periodic jitter frequency analysis).
Button |
Function |
sec |
Displays data in the unit of second. |
UI |
Displays data in the unit of unit interval. |
Select the RUN button (1 in Screen for periodic jitter frequency analysis).
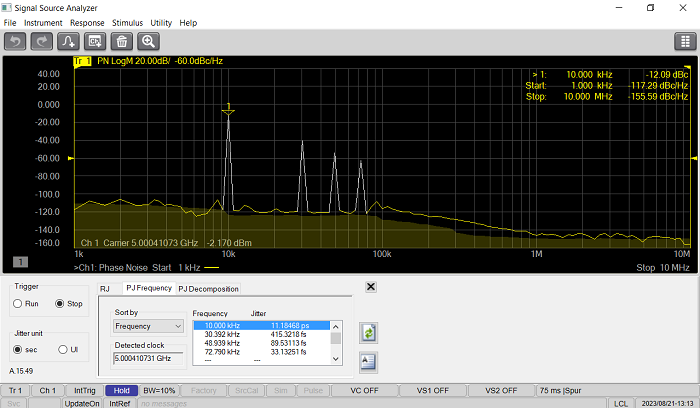
The measurement starts, and the lists of clock frequencies (4 in Screen for periodic jitter frequency analysis) and periodic jitter rms values (5 in Screen for periodic jitter frequency analysis) are displayed.
Select the point you want to analyze from the list (5 in Screen for periodic jitter frequency analysis). When you select a point, the marker moves to the analysis point on the phase-noise measurement screen.
Click the STOP button to finish the measurement (1 in Screen for periodic jitter frequency analysis).
All the frequencies of Frequency-Jitter list measured through PJ Frequency tab are displayed. Previously, only single frequency (displayed as blue) selected in the PJ Frequency tab was displayed.
You can save the analysis result to a file by following the steps below.
Click the tab of the analysis result that you want to save. At this time analysis is carried out once.
Use the Save/Recall function to save the analysis result. For details, refer to Save and Recall Files
You can recall the analysis result from a file by following the steps below.
Use the Save/Recall function. For details, refer to Save and Recall Files
Press the Refresh button (8 in Screen for periodic jitter frequency analysis).
You can save the analysis result of random jitter analysis to a text file by pressing the Export button (9 in Screen for periodic jitter frequency analysis).
Pressing the Export button opens the analysis result file in the Notepad application. Pressing the Export button during measurement writes the analysis result displayed at that time.
This analysis displays the jitter trend and histogram for jitter value analysis. The target frequency for transient measurement is linked.
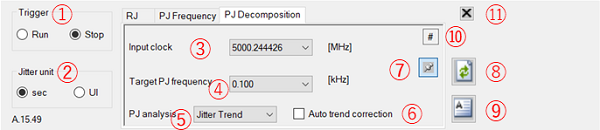
Select PJ Decomposition from the analysis function selection tabs.
Specify a clock frequency (MHz) for the periodic jitter frequency analysis (3 in Screen for periodic jitter decomposition analysis). Frequencies added here are saved in the list.
Enter the period jitter frequency you want to analyze (4 in Screen for periodic jitter decomposition analysis). Frequencies entered here are saved in the list of jitter values (5 in Screen for periodic jitter frequency analysis).
Select an analysis function (5 in Screen
for periodic jitter decomposition analysis).
Button |
Function |
Jitter Trend
|
Displays the jitter trend and analyzes the total jitter. |
Histogram |
Displays the histogram and analyzes the total jitter. |
PJ Separation |
Displays the histogram and Gaussian and analyzes the total jitter and periodic jitter. |
Turns on/off the jitter trend auto correction function
(6 in Screen
for periodic jitter decomposition analysis).
The average of the narrow band measurement frequencies used in transient
measurement is set to the phase reference frequency offset value.
To turn on this function, select the Auto
Trend Correction checkbox.
Select a display unit (2 in Screen
for periodic jitter decomposition analysis).
Button |
Function |
sec |
Displays data in the unit of second. |
UI |
Displays data in the unit of unit interval. |
Select the RUN button (1 in Screen for periodic jitter decomposition analysis).
The previous analysis result is cleared.
Measurement starts, and the analysis result is displayed.
Button |
Function |
Jitter Trend |
|
Histogram |
|
PJ Separation |
|
If fitting fails, ? (question mark) is added at the end of the analysis result.
Click the STOP button to finish the measurement (1 in Screen for periodic jitter decomposition analysis).
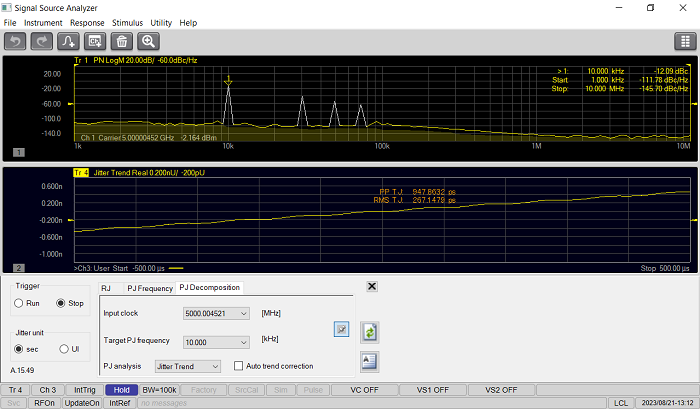
You can display the result of periodic jitter decomposition analysis at your desired position. Clicking the Adjust Position button (7 in Screen for periodic jitter decomposition analysis) will bring up another window on which you can adjust the display position as shown in the figure below.
You can save the analysis result to a file. Follow the steps below.
Click the tab of the analysis result that you want to save. At this time analysis is carried out once.
Use the Save/Recall function to save the analysis result. For details, refer to Save and Recall Files.
You can recall the analysis result from a file by following the steps below.
Use the Save/Recall function. For details, refer to Save and Recall Files.
Press the Refresh button (8 in Screen for random jitter analysis).
You can save the result of random jitter analysis to a text file by pressing the Export button (9 in Screen for periodic jitter decomposition analysis).
Pressing the Export button opens the analysis result file in the Notepad application. Pressing the Export button during measurement writes the analysis result displayed at that time.
If an error occurs during clock jitter measurement, a dialog box appears and the measurement stops. You may encounter the following messages.
Option SSA-J not Installed. |
|
|
The S96302B is not installed. |
Unexpected error. |
|
|
This message may be displayed on the periodic jitter decomposition analysis screen. It indicates that the trend range of the current measurement is greatly different from those of previous measurements and thus analysis cannot be performed. |
Trigger error. |
|
|
This message is displayed when the setting of the E505xA is changed during measurement and thus measurement cannot be triggered. |
No KJitter data on SSA-X |
|
|
This message may be displayed on the periodic jitter frequency analysis screen and the periodic jitter decomposition analysis screen. It indicates that no measurement data exists when you try to save/recall. |
File write error. |
|
|
This message is displayed when writing to a file fails. |