The E505xA provides application software that lets you perform very-low-level clock jitter measurement. To use this function, you need S96302B Precision Clock Jitter Analysis license.
The periods (reference times) of clock sources actually vary depending on a number of factors such as noise. This variation is called jitter, which is generally evaluated using a statistical measurement method. Jitter analysis is an important measurement for applications that handle high-frequency signals.
There are two types of jitter: one dependent on data (Data Correlated or Data Dependent) and one independent of data (Data Uncorrelated or Data Independent). Each type of jitter has various components (jitter components, figure below).
The E505xA can measure only data-uncorrelated jitter components. Such data-uncorrelated jitters are described below.
Jitter |
Description |
Random jitter (RJ) |
Jitter that occurs randomly. Generally, it is expressed as a Gaussian distribution of probability density function (PDF) with an average value (m) and a standard deviation (s). Its peak-to-peak (p-p) value has no limit. As measurement time becomes longer, the p-p value measured during the time becomes larger. |
Periodic jitter (PJ) |
Jitter that occurs over entire periods independent of data patterns. Its peak-to-peak (p-p) value has a limit. Even when measurement time is elongated, the p-p value converges to a finite value. |
The dual Dirac model is used to obtain periodic jitter (PJ). The standard deviation of a random jitter (RJ) distribution is obtained from the RMS value of actually measured random jitter. The dual Dirac model consists of two identical Gaussian defined with the RMS value of the random jitter.
The distance between the two Gaussian is adjusted so that the probability density function (PDF) of the model matches the measured jitter histogram. The model for analysis is identified under the condition that the peak-to-peak (p-p) distance representing 99.9% of the area of the model’s PDF matches the width that contains 99.9% of the area of the measured histogram (dual Dirac Model).
PJ (δ -δ), which is a parameter indicating the actual effect of the periodic jitter component, is defined by the distance between the average values of the two Gaussian. The effective value of periodic jitter independent of its waveform is calculated by rms sum analysis using the standard deviation of the random jitter. This is obtained from the random jitter/periodic jitter histogram giving the RMS value of the periodic jitter.
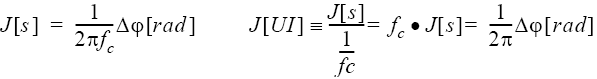
Equation 1 shows the relation between jitter (J) expressed in seconds (s) or unit intervals (UI) and phase deviation (spurious) expressed in radians Δφ, where the frequency of the clock signal is expressed as fc[Hz].
Equation 1
The following equation gives the relation between phase deviation Δφ and single-side-band (SSB) phase-noise spectrum, Lφ (f)[dBc/Hz]. A and B in the equation indicate the frequency range specified with the band marker.
Equation 2
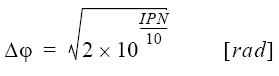
Equation 3
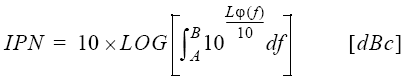
IPN (Integrated Phase Noise) |
Relative value of phase-noise power integrated over a range between frequencies A and B |
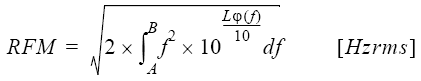
The following equation gives the residual FM component (RFM) within a range of frequencies A and B.
Equation 4
The E505xA uses Phase-Noise measurement and Transient measurement for clock jitter measurement. The user window is used to display the jitter trend and histogram.
The clock jitter measurement provides the following capabilities:
Displaying the jitter trend and total jitter value
Displaying the jitter probability distribution (histogram)
Displaying the periodic jitter (PJ) value and random jitter (RJ) value
The clock jitter measurement of the E505xA provides three analysis functions that you can select from the screen.
Analysis function |
Description |
Random jitter analysis (RJ) |
Displays the clock frequency and the RMS value of the random jitter in phase-noise measurement. |
Frequency analysis for periodic jitter (PJ Frequency) |
In phase-noise measurement, displays the clock frequency and the RMS value of the periodic jitter with the spurious power value display enabled. |
Decomposition analysis for periodic jitter (PJ Decomposition) |
Displays the jitter trend and histogram for jitter value analysis. The target frequency for transient measurement can be linked. |
The following figure shows the decomposition analysis for periodic jitter.
If Auto trend Correction is ON, Jitter trend is removed.