Other topics about Setting Up Test Sequence
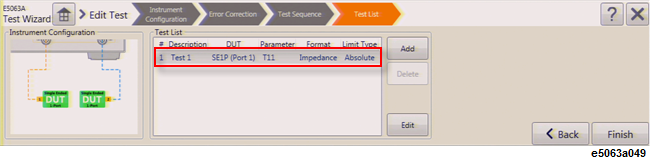
Displays the test information as below:
Test No - The test index number.
Description - Test description as entered by user. If description is not specified, "Test N" is displayed, where N is number.
DUT - Selected DUT topology.
Parameter - Measurement parameter.
Format - Measurement format, e.g. Impedance, Linear, Log Mag etc. When "Volt" is selected, the analyzer converts the measurement result to voltage assuming 1 volt (single ended) or 2 volt (differential) is applied. These assumed stimulus voltage levels are fixed and not related to the actual voltage provided by the analyzer.
Limit Type - Absolute Limit when Time Domain is selected and Multi Segment when S-Parameter is selected.
Add - Adds a new test at the end of the test list.
Delete - Deletes the selected test.
Edit - Edits the selected test. Opens the Measurement Setup Menu where the test configuration is edited.
Select on the test you intend to edit.
Click the Edit button.
Measurement Setup Menu opens where the test configuration is edited. Refer to Defining Each Test and Defining Test Limit.
Click the Add button.
A new line of test is added below the last row of test.
Select the new test.
Click the Edit button to configure the new test.
Select on the test you intend to delete.
Click the Delete button.
The test is removed from the test list.
You can define each test at Measurement Setup Menu page.
Test No displays the sequence number of the test.
Description entry box allows you to enter the descriptive statement about the test. By default, "Test N" is displayed, where N is number.
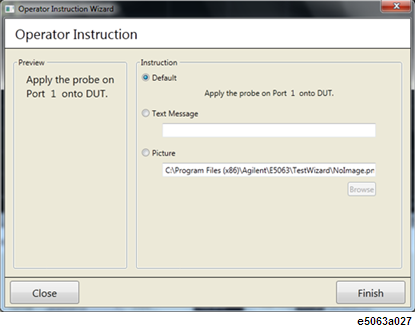
Operator Instruction - Click on the Setup button and the Operator Instruction Wizard shows where you can select the instruction type (default, text and picture) and edit accordingly. The operator instructions dialog box is displayed at the beginning of each test. As for picture, you can select *.png file of any size however, 512 × 320 pixel picture fits the frame well. Picture of other sizes is resized automatically if its larger or smaller than 512 × 320 pixel.
The operator instructions dialog box can be disabled with Operator Instruction Window: On | Off.
Contact Check - Check this box to make a continuous trigger measurement at Execute Test. This allows you to monitor the measurement waveform continuously and you can check if contact is made correctly before execute actual test.
Measure - Allows you to select between Time Domain and S-Parameter measurement. The measurement selection determines the limit selection, located at the right side of the Measurement Setup Menu.
Parameter - Parameter selection is also determined by the measurement selection. Parameter options for Time Domain selection are T11, T21, T12, T22, Tdd11, Tdc11, Tcd11 and Tcc11. S11, S21, S12, S22, Sdd11, Sdc11, Scd11 and Scc11 are for S-Parameter measurement. The available selection is depend on the DUT Topology.
Format - Allows you to select the format type. The list of available format is determined by the measurement selection.
Averaging - Check this box to trigger the averaging function, where a number of sweep is executed with a single trigger. The number of sweep is determined by the averaging factor.
Averaging Factor - Determines the number of sweep executed with a single trigger when averaging function is activated.
IFBW (Frequency Bandwidth) - Determine the frequency bandwidth. The default value is 70 kHz.
This section is determined by the measurement selection:
DUT Length - DUT length can be specified for each test independently. The DUT length is used to calculate the limit test range and auto scale for X axis. The longest DUT length in each test is used for actual measurement setting. The DUT length is displayed at the Test List Menu. When the longest DUT length is changed to above 6.96 ns(*), the memory trace in all the Time Domain tests are cleared. However, when the longest DUT length is set within the range below 6.96 ns(*), the memory trace are not cleared and remain unchanged. To automatically set the DUT Length, click on the Auto button to execute the DUT Length Wizard.
(*) This value is depending on the frequency option. 6.96 ns (Opt. 2H5), 14.8 ns (Opt. 285), 27.9 ns (Opt. 245).
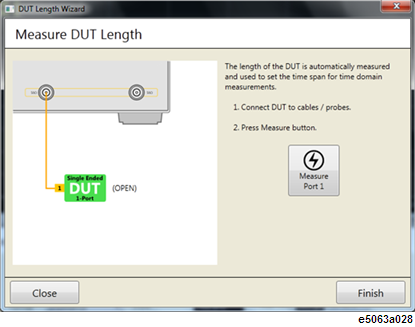
Connect the DUT to cables and probes.
Click the Measure button.
Once done, click Finish.
Rise Time - Allows you to set the rise time and its threshold, with the option of 10%-90% or 20%-80% of the step signal.
Peeling - If checked, allows peeling analysis to be applied.
Start &Stop - Allows you to enter start and stop frequency limit in S-Parameter measurement to set the sweep range.
Points - Allows you to enter the number of points. Default value is 201.
Center/Span - Allows you to enter the center and span value, another way to set the sweep range, other than using the Start and Stop value.
The limit test feature allows you to set the limit line for each trace and then perform the pass/fail judgment for the measurement result. In the limit test, if the upper limit or lower limit indicated by the limit line is not exceeded, the judgment result is pass; if it is exceeded, the judgment result is fail for all measurement points on the trace. Measurement points in a stimulus range with no limit line are judged as pass.
There are 3 types of test limit available: Absolute Limit | Average Limit | Multi Segment. During Time Domain measurement, all 3 test limits are available. However, during S-Parameter measurement, only Multi Segment is available.
Test Limit can be defined at Edit Limit Menu page.
Absolute Limit Test - In Absolute Limit test, the limit test zone is defined by Begin Ratio and End Ratio, and the position of markers 1 and 2. For example, where Marker 1 = 0s, Marker 2 = 100ns, Begin Ratio is 30% and End Ratio is 70%. Hence, 30ns to 70ns is the zone for the Limit Test. Lower and Upper limit can be specified by nominal and range (abs or %). If any measured point is out of limit line, then the test has failed.
Average Limit Test - The limit line is the same as Absolute Limit Test. If averaged measured result within limit line range is out of limit line, then the test has failed.
Multi Segment Limit Test - This test is the same as E5063A limit test. You can specify Max, Min, Off, Begin Stimulus, End Stimulus, Begin Response and End Response for one segment. You can specify up to 100 segments. If any measured point is out of limit line, then the test has failed.
Both absolute limit and average limit have similar selection option. To set the absolute limit, set the below variables:
Begin Stimulus Ratio - Set the lower limit in percentage of the full span of Marker 1 to 2.
End Stimulus Ratio - Set the upper limit in percentage of the full span of Marker 1 to 2.
Tolerance - Can be set either with ratio in percentage or unit depending on format such as impedance in ohm.
More than one frequency range (segments) can be set. To set the multi segment limits:
Add - Add a new segment where you can add the upper and lower limit of the segment.
Delete - Delete the selected (highlighted) segment.
Export - Export the segment data (all of segments) in *.csv format.
Import - Import segment data file (*.csv file).
In order to define the test limit, you can perform measurement and observe the waveform of your reference DUT. To learn more, see Measurement Setup and Edit Limit at Test Wizard Screen Navigation.
Run/Stop button allows you to a continuous measurement. Click once, the trigger is made continuously. Click one more time, the trigger stops.
Select the trace which you want to change the scale.
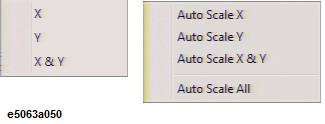
Click on the Auto Scale button on the tool bar or right-click in the graph plot area.
Select the desired scale. Refer to the table below for the details of each selection.
|
Scale |
Details |
|
Auto Scale X |
Auto scaling X axis only, on the active trace |
|
Auto Scale Y |
Auto scaling Y axis only, on the active trace |
|
Auto Scale X & Y |
Auto scaling both X & Y axis, on the active trace |
|
Auto Scale All |
Auto scaling both X & Y axis, on all traces |
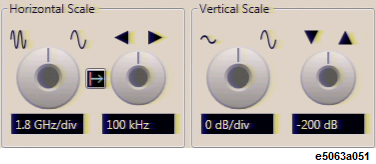
Horizontal and vertical scale adjustment operation can be performed by using the virtual knob. Scale adjustment operation changes the display screen in real time. The scale setting is independent of each test.
Select the trace which you want to change the scale.
Go to Edit Limit Menu.
Using Virtual knob:
Click the left knob under Horizontal Scale. The centre of the knob turns blue.
Scroll up or down the wheel mouse button to change the scale.
Type in Entry box:
Click the box below the left knob under Horizontal Scale. An Entry dialog box appears.
Type the precise value.
Clicking Wave icons:
Click the wave icons above the left knob under Horizontal Scale. Details are as table below:
|
Function Icon |
Details |
|
|
Click to increase the scale in a 1-2-5 sequence. The width of the waveform compresses. The default value for basic time units is 1.0 ns/div. |
|
|
Click to decrease the scale in a 1-2-5 sequence. The width of the waveform expands. |
The reference point of horizontal axis can be selected from the center line or left edge of the displayed graticule.
Click the icon as shown in table below under Horizontal Scale to change the reference point:
|
Function Icon |
Details |
|
|
Reference point of the display graticule to the left edge. The position of left edge is not changed even if you change the scale. |
|
|
Reference point of the display graticule to the center. The position of center is not changed even if you change the scale. |
Select the trace which you want to change the horizontal position.
Go to Edit Limit Menu.
Using Virtual knob:
Click the right knob under Horizontal Scale. The centre of the knob turns blue.
Scroll up or down the wheel mouse button to change the position.
Type in Entry box:
Click the box below the right knob under Horizontal Scale. An Entry dialog box appears.
Type the precise value.
Clicking Arrow icons:
Click the arrow icons above the right knob under Horizontal Scale. Details are as table below:
|
Function Icon |
Details |
|
|
Click to increase the delay from trigger; the waveform moves to the left of the display. |
|
|
Click to decrease the delay from trigger; the waveform moves to the right of the display. |
Select the trace which you want to change the scale.
Go to Edit Limit Menu.
Using Virtual knob:
Click the left knob under Vertical Scale. The centre of the knob turns blue.
Scroll up or down the wheel mouse button to change the scale.
Type in Entry box:
Click the box below the left knob under Vertical Scale. An Entry dialog box appears.
Type the precise value.
Clicking Wave icons:
Click the wave icons above the left knob under Vertical Scale. Details are as table below:
|
Function Icon |
Details |
|
|
Click to increase the scale in a 1-2-5 sequence; the waveform height compress. |
|
|
Click to decrease the scale in a 1-2-5 sequence; the waveform height will expand. |
Select the trace which you want to change the vertical position.
Go to Edit Limit Menu.
Using Virtual knob:
Click the right knob under Vertical Scale. The centre of the knob turns blue.
Scroll up or down the wheel mouse button to change the position.
Type in Entry box:
Click the box below the right knob under Vertical Scale. An Entry dialog box appears.
Type the precise value.
Clicking the Arrow icons
Click the arrow icons above the right knob under Vertical Scale. Details are as table below:
|
Function Icon |
Details |
|
|
Click to increase the offset value; the waveform shift downward. |
|
|
Click to decrease the offset value; the waveform shift upward. |
Drag and drop:
Click and hold the y-axis of the graph plot.
Drag up or down to the desired position and release the button.
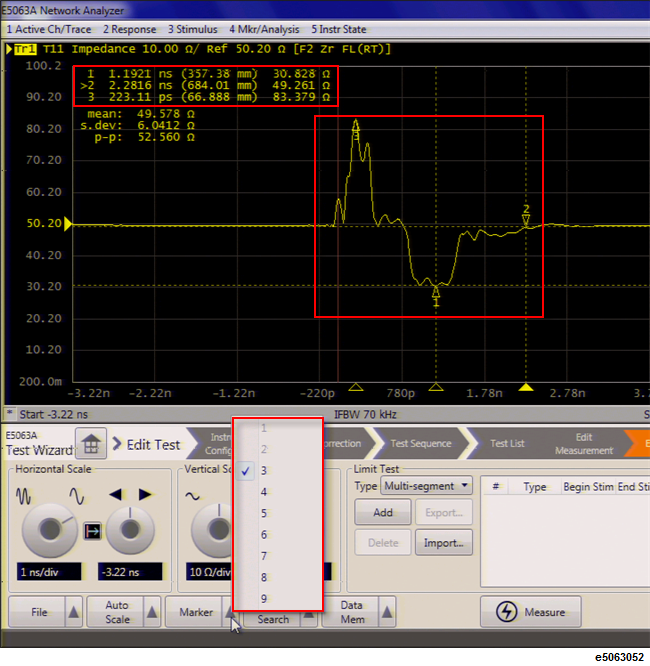
Click on the Marker button.
Select 3 from the list to activate Marker 3.
You can use the markers 3 to 9. The test wizard uses the markers 1 and 2 for DUT length.
Active marker has an arrow head pointing down. Inactive markers have an arrow head pointing up. Only markers 1 and 2 have vertical dotted lines. All marker values are displayed at the upper left corner of the graph view. There are a maximum of 9 markers that can be activated.
Click and hold on the marker, drag the marker to the desired point and release the mouse button.
Click on the desired trace.
Click on the Marker Search button.
Select Max from the drop-down menu.
Click on the desired trace.
Click on the Marker Search button.
Select Min from the drop-down menu.
The marker is constantly on tracking mode when Max or Min is selected. Even moving the marker with the mouse, the marker tracks the Max or Min of the trace and points to it.
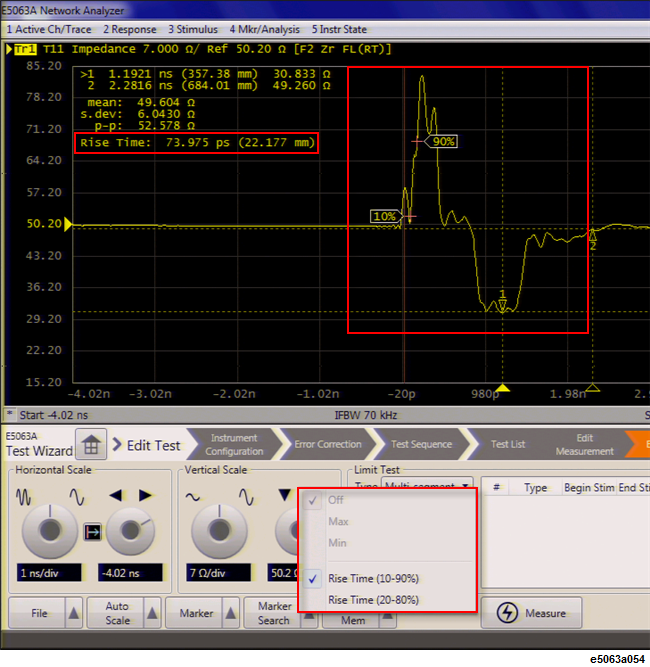
Click on the desired trace.
Click on the Marker Search button.
Select Rise Time (10-90%) or Rise Time (20-80%)from the drop-down menu.
The data is displayed at the top left corner of the graph plot.
Click on the Data Mem button.
Select Data -> Mem from the drop-down menu.
Click on the Data Mem button.
Select Memory from the drop-down menu.
Table below explains other functions in the Data Mem list:
|
Function |
Details |
|
Data -> Mem |
Save Data traces to Memory |
|
Off |
Display off |
|
Data |
Display Data traces only |
|
Memory |
Display Memory traces only |
|
Data & Memory |
Display Data and Memory traces |