This section illustrates how to determine the deviation from a linear phase in the pass band of a 1.09-GHz bandpass filter.
Here, the DUT is evaluated by following the steps.
|
Step |
Description |
|
The DUT is connected. |
|
|
The measurement conditions are defined. |
|
|
The calibration is executed. |
|
|
The DUT is connected again to execute the auto scale function. |
|
|
The electrical delay is specified. |
|
|
The statistics data function (peak-to-peak) is used to determine the deviation from a linear phase. |
Connect the DUT as shown below.
The measurement conditions are defined by following the steps described below.
|
Setup Description |
Key Operation |
|
Presetting |
Preset > OK |
|
Center frequency: 1.09 GHz |
Center > 1 > . > 0 > 9 > G/n |
|
Frequency span: 20 MHz |
Span > 2 > 0 > M/u |
|
Measurement parameter: S21 |
Meas > S21 |
|
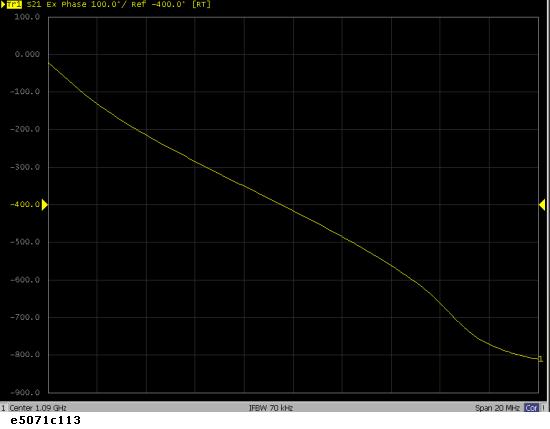
Data format: Expand Phase |
Format > Expand Phase |
|
Executing the Auto Scale |
Scale > Auto Scale |
The THRU response calibration is executed.
|
Setup Description |
Key Operation |
|
Executing the THRU response |
(A THRU standard is connected instead of a DUT) Cal > Calibrate > Response (Thru) > Thru > Done |
The DUT is connected again as shown in Connect the DUT to execute the auto scale.
|
Setup Description |
Key Operation |
|
Executing the auto scale |
Scale > Auto Scale |
The electrical delay is entered to flatten the phase trace.
|
Setup Description |
Key Operation |
|
Entering the electrical delay |
Scale > Electrical Delay > Up/Down Arrow keys or Rotary Knob (Flattening a trace) |
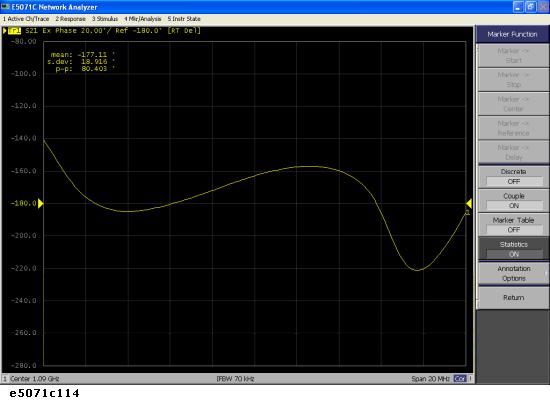
The statistics data is used to read the deviation from a linear phase (peak-to-peak).
|
Setup Description |
Key Operation |
|
Executing the auto scale |
Scale > Auto Scale |
|
Displaying the statistics data |
Marker Function > Statistics (Turn it ON.) |