The E5071C allows you to display measured S-parameters by using the following data formats. The data format can be preset to factory settings using the Preset option.
Other topics about Setting Measurement Conditions
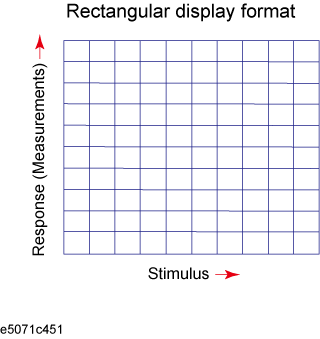
Rectangular display formats draw traces by assigning stimulus values (linear scale) to the X-axis and response values to the Y-axis. Eight different formats are available depending on the selection of data for the Y-axis.

|
Type |
Y-axis Data Type |
Y-axis Unit |
Application Examples |
|
Log magnitude format |
Magnitude |
dB |
|
|
Phase format |
Phase (displayed in range from -180° to +180° ) |
Degrees (° ) |
Measurement of deviation from linear phase |
|
Expanded phase format |
Phase (can be displayed above +180° and below -180° ) |
Degrees (° ) |
Measurement of deviation from linear phase |
|
Positive phase format |
Phase (displayed in range from 0° to +360° ) |
Degrees (° ) |
Measurement of deviation from linear phase |
|
Group delay format |
Signal transfer delays within the DUT |
Seconds (s) |
Group delay measurement |
|
Linear magnitude format |
Magnitude |
(Abstract number) |
Reflection coefficient measurement |
|
SWR format |
(ρ: reflection coefficient) |
(Abstract number) |
Measurement of standing wave ratio |
|
Real format |
Real part of measured complex parameter |
(Abstract number) |
|
|
Imaginary format |
Imaginary part of measured complex parameter |
(Abstract number) |
|
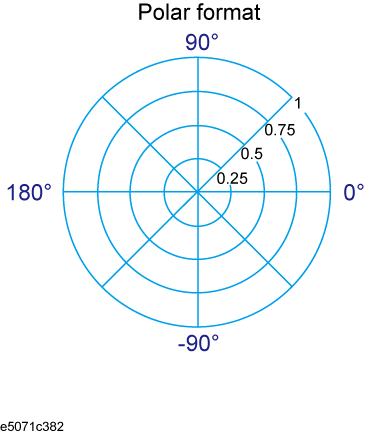
In the polar format, traces are drawn by expressing the magnitude as a displacement from the origin (linear) and phase in an angle counterclockwise from the positive X-axis. This data format does not have a stimulus axis, so frequencies must be read by using the marker. The polar format allows users to select one of the following three data groups for displaying the marker response values.
Linear magnitude and phase (° )
Log magnitude and phase (° )
Real and imaginary parts

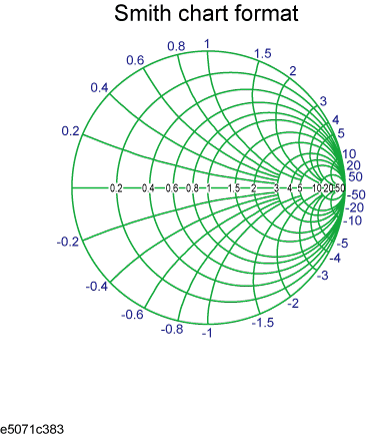
The Smith chart format is used to display impedances based on reflection measurement data of the DUT. In this format, traces are plotted at the same spots as in the polar format. The Smith chart format allows users to select one of the following five data groups for displaying the marker response values.
Linear magnitude and phase (° )
Log magnitude and phase (° )
Real and imaginary parts
Resistance (ohm), Reactance (ohm), and inductance (H) or capacitance (F)
Conductance (S), susceptance (S), and capacitance (F) or inductance (H)

Use the following procedure to select a data format.
Press Channel Next (or Channel Prev) and Trace Next (or Trace Prev) to select the trace for which the data format will be set.
Press Format.
Press the softkey that corresponds to the desired data format.
|
Softkey |
Function |
|
Log Mag |
Selects the log magnitude format |
|
Phase |
Selects the phase format |
|
Group Delay |
Selects the group delay format |
|
Smith - Lin / Phase |
Selects the Smith chart format (with linear magnitude and phase as the marker response values) |
|
Smith - Log / Phase |
Selects the Smith chart format (with log magnitude and phase as the marker response values) |
|
Smith - Real / Imag |
Selects the Smith chart format (with the real and imaginary parts as the marker response values) |
|
Smith - R + jX |
Selects the Smith chart format (with resistance and reactance as the marker response values) |
|
Smith - G + jB |
Selects the Smith chart format (with conductance and susceptance as the marker response values) |
|
Polar - Lin / Phase |
Selects the polar format (with linear magnitude and phase as the marker response values) |
|
Polar - Log / Phase |
Selects the polar format (with log magnitude and phase as the marker response values) |
|
Polar - Real / Imag |
Selects the polar format (with the real and imaginary parts as the marker response values) |
|
Lin Mag |
Selects the linear magnitude format |
|
SWR |
Selects the SWR (standing wave ratio) format |
|
Real |
Selects the real format |
|
Imaginary |
Selects the imaginary format |
|
Expand Phase |
Selects the expanded phase format |
|
Positive Phase |
Selects the positive phase format |