Other topics about Time Domain Analysis
The transformation function lets you transform a response in the frequency domain to the corresponding response in the time domain.
|
Item |
Description |
|
Selects the transformation type from the following. Band pass mode You can set the sweep range arbitrarily. This is suitable for devices through which signals within a certain frequency range pass such as filters. Low pass mode Simulates the TDR measurement. This mode is suitable for devices through which dc current or signals of many frequencies pass, such as cables. The low pass mode provides two types of modes: low pass step and low pass impulse. |
|
|
Sets the window to reduce the ringing phenomenon, in which a waveform's waves are caused due to the fact that the frequency domain is finite. |
|
|
Calculates the following values to obtain the necessary resolution and measurement range in the time domain. Sweep range Number of points Window width |
|
|
Sets the sweep range and the number of points to the values calculated above. |
|
|
Sets the range displayed on the graph. |
|
|
Enables the transformation function. |
There are two types of transformation to the time domain: band pass and low pass. The appropriate transformation type depends on the DUT.
|
Item |
Band pass |
Low pass |
|
Appropriate DUT |
DUTs that do not operate with dc current such as band pass filters. |
DUTs that operate with dc current such as cables. |
|
Input signal |
You can simulate the response to the impulse signal. |
You can simulate the TDR measurement. You can simulate the response to both the impulse signal and step signal. |
|
Selection of the sweep range |
You can select the sweep range arbitrarily. |
Because dc data are estimated from the first few points, the frequencies of measurement points must be multiples of the start frequency. |
|
Transmission/ reflection measurement |
You can perform both transmission and reflection measurements. |
You can perform both transmission and reflection measurements. |
|
Identification of mismatches |
You can identify the locations of mismatches. |
You can identify the locations of mismatches and the type of impedance (capacitive or inductive). |
|
Resolution |
|
The resolution in the time domain increases by two times over that in the band pass mode. |
|
Available data format |
|
Real format In the low pass mode, the real format is useful because the time axis data do not have phase information. |
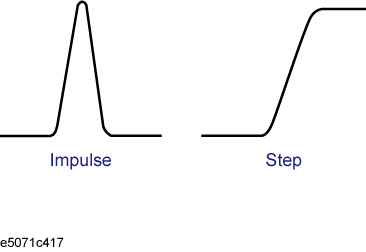
The E5071C lets you simulate the response from the DUT to two types of signals: impulse signal and step signal. The impulse signal is a pulse-shape signal in which the voltage rises from 0 to a certain value and returns to 0 again. The pulse width depends on the frequency sweep range. The step signal is a signal in which the voltage rises from 0 to a certain value. The rise time depends on the maximum frequency within the frequency sweep range.
For more information on how the frequency span setting affects the pulse width and the rise time, refer to Calculating necessary measurement conditions.
Step signal and impulse signal

Press Channel Next/Channel Prev keys and Trace Next/Trace prev keys to activate a trace for which you want to set the transformation type.
Press Analysis key, then click Transform to display the Transform menu.
Type and then press one of the softkeys to specify the type.
Press Format key to display the "Format" menu and then select the data format.
Because the E5071C transforms data within a finite frequency domain to data in the time domain, an unnatural change of data at the end points within the frequency domain occurs. For this reason, the following phenomena occur.
Width of impulse signal and rise time of step signal
A time width occurs in the impulse signal and a rise time occurs in the step signal.
Sidelobe
Sidelobes (small peaks around the maximum peak) occur in the impulse signal and the step signal. Ringing occurs on the trace due to sidelobes, which reduces the dynamic range.
By using the window function, you can lower the level of sidelobes. However, the width of the impulse and the rise time of the step become larger as a penalty. You can select from three types of windows: maximum, normal, and minimum. The following table shows the approximate relation between the window and the sidelobe/impulse width.
|
Window |
Sidelobe level of impulse signal |
Width of impulse (50% in low pass mode) |
Sidelobe level of step signal |
Rise time of step signal (10 - 90%) |
|
Minimum |
- 13 dB |
0.60/frequency span |
- 21 dB |
0.45/frequency span |
|
Normal |
- 44 dB |
0.98/frequency span |
- 60 dB |
0.99/frequency span |
|
Maximum |
- 75 dB |
1.39/frequency span |
- 70 dB |
1.466/frequency span |
The window function is available only when the response in the time domain is displayed. It does not have any effect when the response in frequency domain is displayed. The following figure shows the effect of the window when measuring the reflection of a short circuit in the time domain.

Press Channel Next/Channel Prev keys and Trace Next/Trace prev keys to activate a trace for which you want to set the window.
Press Analysis key, then click Transform to display the Transform menu.
Press Window and then select a window type.
|
Softkey |
Function |
|
Maximum |
Sets the window type to maximum. b of the Kaiser Bessel function is set to 13. |
|
Normal |
Sets the window type to normal. b of the Kaiser Bessel function is set to 6. |
|
Minimum |
Sets the window type to minimum. b of the Kaiser Bessel function is set to 0. |
|
Rise Time |
Sets the window by specifying the impulse width or the step rise time. The lower limit can be set to the value when the window is the minimum, the upper limit when the window is the maximum. |
|
Kaiser Beta |
Sets the window by specifying the b value of the Kaiser Bessel function. The Kaiser Bessel function determines the shape of the window. The allowable setting range is 0 to 13. |
By specifying Kaiser Beta, Impulse Width, or Rise Time, you can specify a window that is not classified into the three window types. Conversely, when you specify a window type, these values are set automatically.
To use the transformation function efficiently, you need to make the following three settings appropriately.
Resolution of the response
Measurement range
Sidelobe
This section describes the details of these settings.
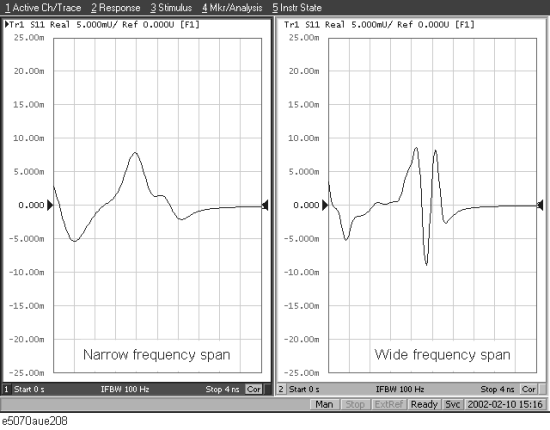
The following figure shows an example when measuring the same cable while changing the sweep span. When measured in a narrower sweep range, the overlap between two peaks is larger than when measured in a wider sweep range. By performing measurement in a wider sweep range, adjacent peaks can be clearly separated, which means that the response resolution is smaller.
Effect of frequency sweep range on resolution

The sweep range affects the width of the impulse signal and the rise time of the step signal. The width of the impulse signal and the rise time of the step signal are inversely proportional to the sweep range. Therefore, the wider the sweep range is, the shorter these times are.
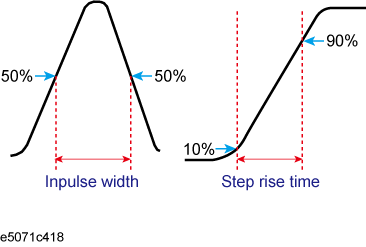
The resolution is equal to the width defined at the point of 50% of the impulse signal or the rise time defined at the points of 10% and 90% of the step signal.
Definitions of impulse width and step rise time

Lowering the sidelobe level with the window function elongates the width of the impulse signal and the rise time of the step signal. As described in Effect of frequency sweep range on response resolution, because the response resolution is equal to the width of the impulse signal and the rise time of the step signal, lowering the sidelobe level enlarges the response resolution. The following table shows the approximate relationship between the response resolution and the window setting.
Correspondence of Window setting and response resolution
|
Window |
Low pass step |
Low pass impulse |
Band pass |
|
Minimum |
0.45/stop frequency |
0.60/stop frequency |
1.20/frequency span |
|
Normal |
0.99/stop frequency |
0.98/stop frequency |
1.95/frequency span |
|
Maximum |
1.46/stop frequency |
1.39/stop frequency |
2.77/frequency span |
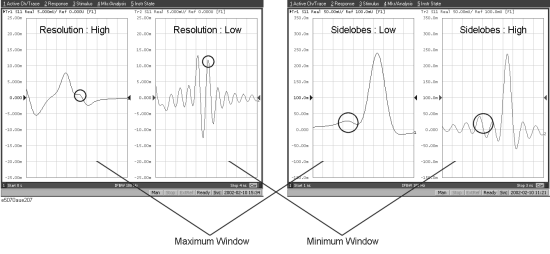
The following figure shows how the response changes as the window shape changes. If the magnitudes of adjacent peaks are comparable, you need to make the resolution higher; if they differ significantly, you need to set the window so that smaller peaks with lower sidelobes appear.
Effect of window on response resolution

Although both transformation types, band pass and low pass impulse, simulate the response of the impulse signal, the impulse width in the low pass impulse mode is half the width of that in the band pass mode as shown in the table above. Therefore, the resolution is better in the low pass mode. If the DUT can be measured in the low pass mode, response data with better resolution is obtained in the low pass mode.
In the time domain function, the measurement range means the range within which the response can be measured without repetition. The repetition of the response occurs because measurement in the frequency domain is performed discretely instead of continuously. The measurement range is inversely proportional to the frequency difference between adjacent measurement points. The frequency difference between measurement points Delta F is expressed as follows by using the span of the sweep frequency Fspan and the number of points Nmeas.

Therefore, the measurement range is proportional to the number of points-1 and inversely proportional to the span of the sweep range. To enlarge the measurement range, use one of the following methods:
Increase the number of points.
Narrow the span of the sweep range.
When you change the above settings after performing calibration, you need to perform calibration again.
The sweep range is expressed as time or distance. The time of the measurement range Tspanis as follows:
![]()
The distance of the measurement range Lspan is expressed as follows using the velocity factor V and the speed of light in a vacuum c (3*E8 m/s).

The maximum length of the DUT that can be measured in the transmission measurement is Lspan. On the other hand, in the reflection measurement, bemcause the signal goes and returns, it is 1/2 of Lspan.
The velocity factor varies depending on the material through which the signal propagates: 0.66 for polyethylene and 0.7 for PTFE.
The following table shows the effect of changes in the measurement conditions on the response resolution and the measurement range.
|
Change in setting |
Response resolution |
Measurement range |
Sidelobe |
|
Widening the sweep range |
Becomes smaller |
Becomes narrower |
Does not change |
|
Setting the window type to maximum |
Becomes larger |
Does not change |
Becomes lower |
|
Increasing the number of points |
Does not change |
Becomes wider |
Does not change |
Press Channel Next/Channel Prev keys to activate the channel you want to set. The frequency range and the number of points are common to all of the traces in the channel. If you want to use different settings, make them on another channel.
Press Sweep Setup key, then press Sweep Type > Lin Freq to set the sweep type to linear sweep. When the sweep type is set to other than the linear sweep, the time domain function is not available.
Set the sweep range using the Start/Stop or Center/Span keys.
Press Sweep Setup key, then press Points and then enter the number of points. When performing measurement in the low pass mode, press Analysis > Transform > Set Freq Low Pass to adjust the frequency range so that it is appropriate for the low pass mode. The frequency changes depending on the stop frequency as shown below.
|
Condition of stop frequency |
Frequency setting |
|
>= Flow * the number of points |
Start frequency = stop frequency/number of points |
|
< Flow * the number of points |
Start frequency: Flow Stop frequency = Flow * Number of points |
Flow =9 kHz or 100 KHz (Depending upon the installed option)
When the frequency settings satisfy the conditions shown above, the Set Freq Low Pass key is displayed in gray.
The E5071C has the following limitations on the display range you can set.
Lower limit: -Tspan
Upper limit: Tspan
Tspan is the measurement range expressed in time obtained in Measurement range.
The number of response points displayed on the graph is the same as the number of points regardless of the response resolution.
Press Channel Next/Channel Prev keys and Trace Next/Trace Prev to activate the trace for which you want to set the display range.
Press Analysis key, then click Transform to display the "Transform" menu.
Press each of the following softkeys and then specify the display range. Distance corresponding to the setting time is displayed at the side of the set value in the data entry bar. The displayed distance is a value taking the velocity factor into consideration.
|
Softkey |
Function |
|
Start |
Sets the start value of the display range in time |
|
Stop |
Sets the stop value of the display range in time |
|
Center |
Sets the center value of the display range in time |
|
Span |
Sets the span of the display range in time |
You cannot use hardkeys to set the display. The hardkeys are dedicated to specifying the sweep range.
Press Channel Next/Channel Prev keys and Trace Next/Trace Prev to activate the trace for which you want to use the transformation type.
Press Analysis key, then click Transform to display the "Transform" menu.
Press Transform to enable (ON) the transformation function.
The following requirements must be met to enable the transformation function.
The sweep mode is the linear sweep.
There are three or more measurement points.