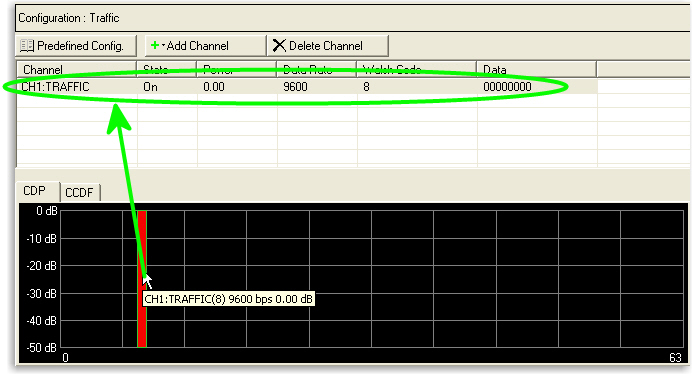
This table enables you to view the key parameters for the channel in the carrier. You can also add or delete channels using the buttons above the table (see descriptions below). Clicking the channel row activates the setup tables for that channel. You can use a maximum of 1 channel.
Opens a  drop-down menu
with the predefined channel configuration selection. Double-clicking the
configuration replaces the current configuration in the Channel Configuration
Summary Table.
drop-down menu
with the predefined channel configuration selection. Double-clicking the
configuration replaces the current configuration in the Channel Configuration
Summary Table.
Adds a new Traffic channel to the current channel configuration.
Deletes the highlighted channels in the Channel Configuration Summary Table and the current configuration.
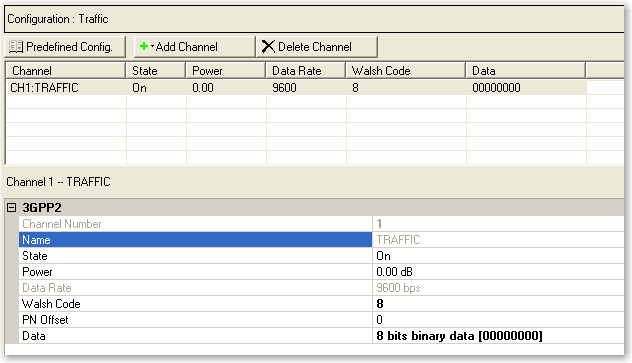
Displays the channel number selected in the Channel Configuration Summary Table. You can change the channel configuration or add individual channels using the Add Channel button at the top of the table.
Displays the channel type or name that is selected in the Channel Configuration Summary Table.
Selections: On, Off
Default: On
Sets the state of the selected channel to either on or off. The ![]() icon at the right of the entry box displays the
valid selections.
icon at the right of the entry box displays the
valid selections.
Range: –40 to 0 dB
Default: 0 dB
Sets the power of the selected channel.
Displays the data rate of the selected channel. This value is fixed at 9600 bps for IS-95-A.
Range: 0 to 63
Default: 0
Sets the Walsh Code for the selected channel.
Range: 0 to 511
Default: 0
Sets the Pseudo Noise (PN) offset for the selected channel.
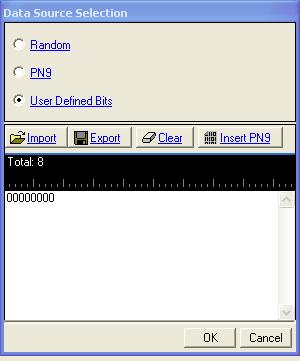
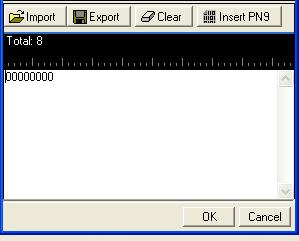
Allows you to select or specify the data for the selected channel. The
 icon at the right of the entry box opens the Data Source Selection dialog box.
Shows the Code Domain Power (CDP) graph. This graph shows the position
and power level of each channel, relative to the Walsh code applied. Select
the channel setup in the tree view
to view the CDP distribution for that carrier.
Click on a channel in the graph
to view the parameter selections for that channel.
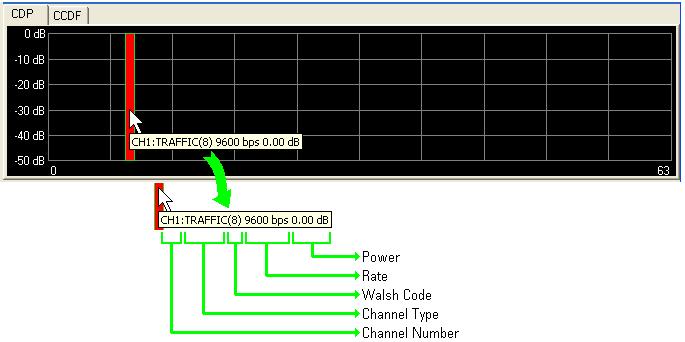
Hold the cursor over any individual channel to view a tool tip showing the channel number, type, Walsh Code, rate, and
power.
Shows the Complimentary Cumulative Distribution Function (CCDF) graph. This graph shows the plot and peak-to-average values for the current carrier. This topic describes the CCDF functionality using the graph in the Channel Setup view.
The CCDF graph displays the probability (in percentage) of the generated carrier's calculated peak-to-average power ratio (measured in dB) meeting or exceeding a certain level. The table to the left of the CCDF plot displays the calculated peak-to-average values for the carrier. For additional information, see Understanding CCDF Curves.
Click  or
or  from the main tool
bar to generate an I/Q waveform and plot the CCDF graph using the
current channel configuration. Any changes to the channel configuration
setup do not appear on the graph until you generate the waveform. The
status bar at the bottom of the screen shows
waveform generation progress.
from the main tool
bar to generate an I/Q waveform and plot the CCDF graph using the
current channel configuration. Any changes to the channel configuration
setup do not appear on the graph until you generate the waveform. The
status bar at the bottom of the screen shows
waveform generation progress.
Each time you adjust parameters and generate a waveform, a plot is added
to the graph.
The graph retains your three most recent plots (in shades of gray), allowing
you to make comparisons of waveform characteristics.
Use the buttons shown below to plot the Gaussian data, reference data and generated waveform data to the CCDF graph. The graph's initial state shows only the Gaussian curve (blue) until you generate a waveform.
Toggles the view of the band-limited Gaussian noise curve (blue).
Toggles the view of the reference curve (red). The reference appears as a flat line until you generate a waveform and click the button.
Sets the current waveform curve to yellow and the reference curve to red. Click the button to view the reference curve.