Frame and Burst Plots
Frame Plot
Clicking on a Carrier in the  tree view
displays a group of plots at the bottom of the current
window. Clicking the Frame tab displays the Frame Plot View, that shows
a block diagram of how the frame components fit on a time axis. The frame
plot displayed depends on the frame duration, output mode, and the downlink ratio that you set in the Waveform Setup
node. As you add zones or change the parameters for a zone, the display
changes accordingly.
tree view
displays a group of plots at the bottom of the current
window. Clicking the Frame tab displays the Frame Plot View, that shows
a block diagram of how the frame components fit on a time axis. The frame
plot displayed depends on the frame duration, output mode, and the downlink ratio that you set in the Waveform Setup
node. As you add zones or change the parameters for a zone, the display
changes accordingly.
____________________________ _
_
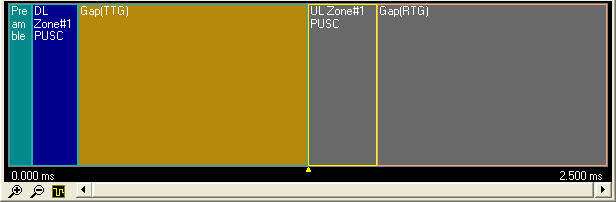
The frame plot view includes the following graphical
features:
-
Non-transmitted parts are shown
in a grayed out color.
-
If a portion is not configured,
a gap is shown in the frame for that period of time.
-
A marker along the bottom of
the graph ( ) displays the division point of the downlink and uplink (TDD
only) as set in the downlink ratio in Waveform Setup.
) displays the division point of the downlink and uplink (TDD
only) as set in the downlink ratio in Waveform Setup.
-
 zooms in by 2x or zooms out (0.5x) the x-axis of the
display.
zooms in by 2x or zooms out (0.5x) the x-axis of the
display.
-
This button  overlays the amplitude plot on the frame
plot. The highest powered symbol is scaled to 0 dB.
overlays the amplitude plot on the frame
plot. The highest powered symbol is scaled to 0 dB.
-
A scroll bar enables you to view a specific area of
interest.
-
A yellow rectangle surrounds the frame component corresponding
to the highlighted node in the tree view.
-
Double-clicking a frame component jumps to the corresponding
component in the tree and parameter view.
-
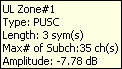
Moving the cursor over a component displays additional information
for that particular component, such as the zone type, length in symbols,
and the maximum number of subchannels.
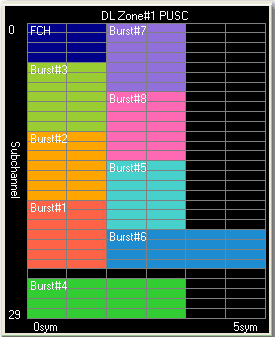
Burst Plot
For any carrier configured as 802.16 OFDMA Advanced,
clicking any zone in the tree view
displays the burst
allocation for that zone to the right of the frame plot. The grid
displays the bursts with the number of subchannels (frequency) on the
vertical axis and number of symbols (time) along the horizontal axis.
The burst display (shown below) represents the data region that can be
transmitted in the downlink by a base station to a subscriber station
or in the uplink to the base station.