Click or in the ![]() tree view.
The graph view is located at the bottom of the Carrier n
and Component Carrier n
nodes. For multiple antenna configurations, a tab for each antenna port
is displayed above the graph view. Click the tab of the antenna port for
which you want to view a Power Envelope graph. Click the Power Envelope tab to display
the Power Envelope graph.
tree view.
The graph view is located at the bottom of the Carrier n
and Component Carrier n
nodes. For multiple antenna configurations, a tab for each antenna port
is displayed above the graph view. Click the tab of the antenna port for
which you want to view a Power Envelope graph. Click the Power Envelope tab to display
the Power Envelope graph.
The power envelope graphing feature is not supported for CW or Imported Waveforms.
The Power Envelope graph automatically updates when the Instrument node's Amplitude parameter is changed. But, for all other parameters, the graph is updated only after waveform generation.
If the selected hardware does not have an absolute amplitude setting, the Power Envelope graphs shows the absolute power based on the assumption that the output power is -10 dBm.
This topic contains the following sections:
The following carriers are supported:
Basic LTE TDD
PRACH LTE TDD
Advanced LTE TDD
Basic LTE-A TDD
PRACH LTE-A TDD
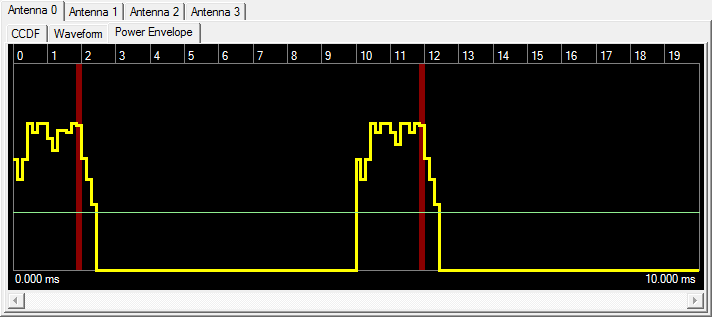
The power envelope graph displays the absolute power of a specified symbol and the absolute average power of a waveform.
The graph covers one frame at once. If the generated waveform is longer than one frame, the graph can be scrolled using a scroll bar below the graph.
The absolute power is calculated based on the ALC marker data (a bit sequence). The ALC marker data of a carrier is set on the symbols with the highest power and then summed to the other carriers after generation. This summing is done by calculating the logical product (AND). This AND data can lose “ON” areas (where the ALC successfully calculates and graphs the absolute power) depending on each of the different carrier‘s individual settings. Where, this loss of “ON” area occurs, the absolute power is not shown and the relative power of the highest symbol is shown instead.
The CCDF, Waveform, and Power Envelope graphs are minimized
in the initial view of the Carrier node. To
view the graphs, ![]() click and drag the border
above the CCDF, Waveform, and Power Envelope graphs.
click and drag the border
above the CCDF, Waveform, and Power Envelope graphs.
Click  or
or
 from the main tool bar to generate an I/Q waveform and plot the power envelope using the current channel configuration. Changes to the waveform configuration
do not appear on the graph until you generate the waveform. The status
bar at the bottom of the screen shows waveform generation progress.
The plot is shown in the image below. Refer to the Legend and to Pop-up Annotation. Slot numbers are shown along the top of the graph for all carriers.

|
Yellow line |
shows the power envelope |
|
Green line |
shows the average power calculated from the power envelope |
|
Red background |
shows the ALC region when the absolute power is successfully determined |
A pop-up annotation is shown by placing a mouse cursor on the graph. The unit of the power readout depends on whether the absolute power is successfully determined or not. If it succeeds, “dBm” is used; otherwise, “dB” is shown.
If the mouse cursor is close to the average power line, the ![]() average power is shown in the pop-up; otherwise, the power of the position is shown depending on the carrier.
average power is shown in the pop-up; otherwise, the power of the position is shown depending on the carrier.
For ![]() non-PRACH carriers, the slot number, the symbol number and the power of a specified symbol are shown. If the symbol is not used, dash symbols (“---“) are shown as the power.
non-PRACH carriers, the slot number, the symbol number and the power of a specified symbol are shown. If the symbol is not used, dash symbols (“---“) are shown as the power.
For ![]() PRACH carriers, the subframe number and the burst power of a specified subframe are shown. If the subframe does not contain a burst, dash symbols (“---“) are shown as the power.
PRACH carriers, the subframe number and the burst power of a specified subframe are shown. If the subframe does not contain a burst, dash symbols (“---“) are shown as the power.