In this topic:
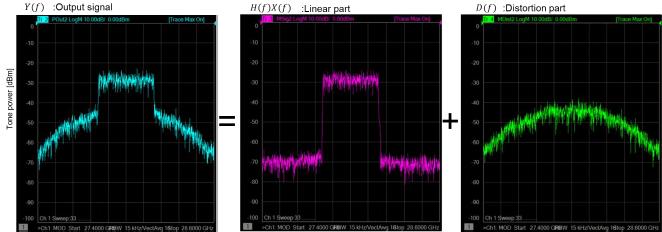
The DUT is stimulated with a low-level signal to measure its linear parameters and a high-level modulated signal to measure its distortion characteristics. The modulation distortion application processes the data and compares the input spectrum X(f) and the output spectrum Y(f) using a process known as spectral correlation. As a result, the modulation distortion application decomposes the output signal spectrum into two parts: H(f)*X(f) and D(f). H(f)*X(f) linearly correlates to the input while D(f) represents the distortion which does not correlate to the input.
The following Distortion Model describes noise and distortion in an amplifier and will help in understanding the Distortion Measurement Parameters (shown below):
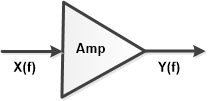
Y(f) = C(f) * S21(f) * X(f) + D(f)
[H(f) = C(f) * S21(f)]
where:
X(f) = Measured input signal
Y(f) = Measured output signal
C(f) = Compression
S21(f) =Linear flatness and gain
D(f) = Output modulation distortion
How to select and configure Measurement Parameters |
|
|
Using Hardkey/SoftTab/Softkey |
Using a mouse |
|
|
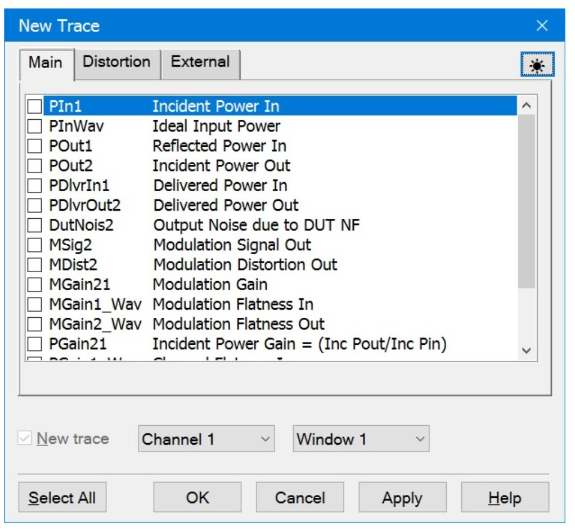
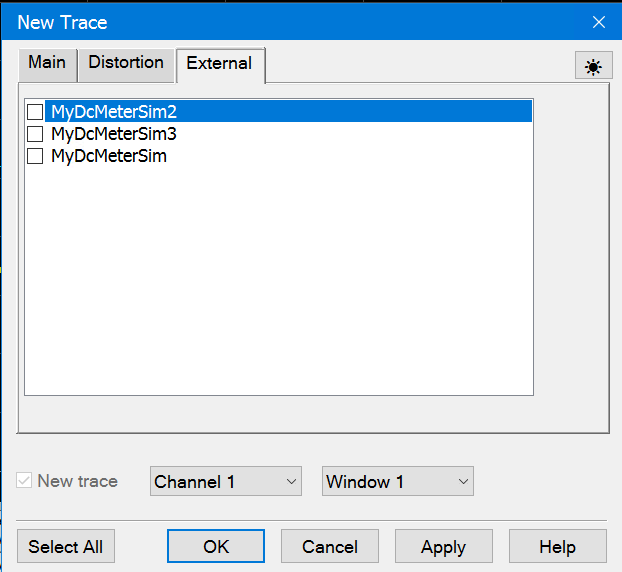
Select from the parameters to measure power, S-parameters, or distortion characteristics.
New Trace - Add a new trace.
Channel N - Select a channel number for the new modulation distortion trace.
Window N - Select to create the new trace in an existing window or new window.
Select All - Select all measurement parameters.
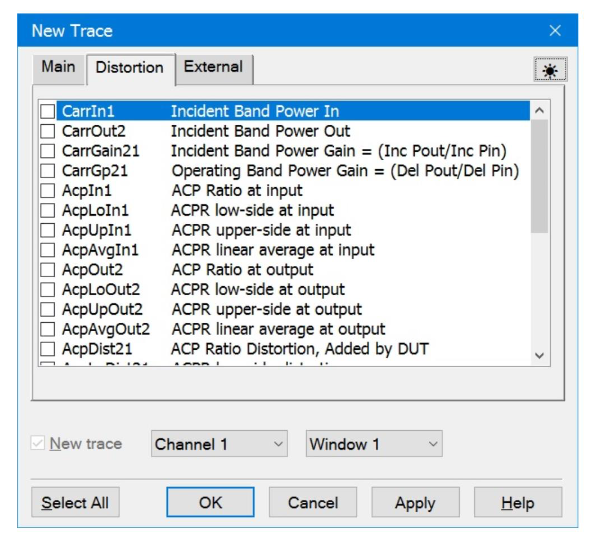
The following tables describe the available Distortion Measurement Parameters for each DUT type and for the Main, Distortion and External tabs.
Note: The parameter names in the table assume we are testing a DUT with Port 1= input and Port 2 = output.
|
DUT Type |
Description |
Default Format |
|
|
Amplifier |
Mixer |
||
|
PIn1 |
PIn1 |
Incident Input power to the DUT. |
dBm/Hz |
|
PInWav |
PInWav
|
Power of the ideal modulation file loaded into the source. RMS power equals source setting. |
dBm/Hz
|
|
POut1 |
POut1 |
Power reflected from the DUT input |
dBm/Hz |
|
PIn2 |
PIn2 |
Reflected output power incident on the DUT output. |
dBm/Hz |
|
POut2 |
POut2 |
Incident Output Power on the VNA test port at the DUT output. |
dBm/Hz |
|
PDlvrIn1 |
PDlvrIn1 |
Power delivered to the DUT input. This is calculated from incident power on the DUT (PIn1) and reflected power from the DUT (Pout1). Used for load-pull measurements. |
dBm/Hz |
|
PDlvrOut2 |
PDlvrOut2 |
Power delivered to the receiver on at the DUT output. This is calculated from the incident power on the VNA port at the DUT output (POut2) and the reflected power from the VNA port at the DUT output (PIn2). Used for load-pull measurements. |
dBm/Hz |
|
DutNois2 |
DutNois2 |
Noise power delivered to the receiver, calculated from DUT NF value and measured DUT gain. |
dBm/Hz
|
|
MSig2 |
MSig2 |
Output modulation signal - C(f) * S21(f) * X(f) |
dBm/Hz |
|
MDist2 |
MDist2 |
Output modulation distortion - D(f) |
dBm/Hz |
|
MDistIR2 |
MDistIR2 |
Output Modulation Distortion, input referred. This is only for troubleshooting and is not visible unless the user enters a DIAG command. |
dBm/Hz |
|
MGain21 |
MGain21 |
DUT modulation gain - C(f) * S21(f) = H(f) This gain is a smooth complex function, with smooth referring to the mathematical property that it has continuous derivatives of infinite order |
dB |
|
MGain1_Wav |
MGain1_Wav |
Mod gain from Ideal Waveform to DUT Input, indicating modulation channel flatness of source. |
dB |
|
MGain2_Wav |
MGain2_Wav |
Mod gain from Ideal Waveform to DUT output, indicating modulation channel flatness of DUT. |
dB |
|
PGain21 |
PGain21 |
Incident Power Gain = Y(f) / X(f) = (Incident Pout)/(Incident Pin). |
dB |
|
PGain1_Wav |
PGain1_Wav |
Channel Flatness In = X(f) / (Ideal Waveform) = (Incident Pin)/(Ideal Waveform). This indicates channel flatness of source. |
dB |
|
PGain2_Wav |
PGain2_Wav |
Channel Flatness Out = Y(f) / (Ideal Waveform) = (Incident Pout)/(Ideal Waveform) at output. Indicates channel flatness of DUT. |
dB |
|
Gp21 |
Gp21 |
Operating Power Gain = (Delivered Pout) / (Delivered Pin). |
dB |
|
LMatch2 |
LMatch2 |
Load match at the DUT output. For Rx, there is no load match. |
dB |
Note: Single Port EVM Analysis is a Licensed Feature and is only available on PNA/PNA-X instruments. Learn more about Licensed Features.
|
DUT Type |
Description |
Default Format |
|
|
Amplifier |
Mixer |
||
|
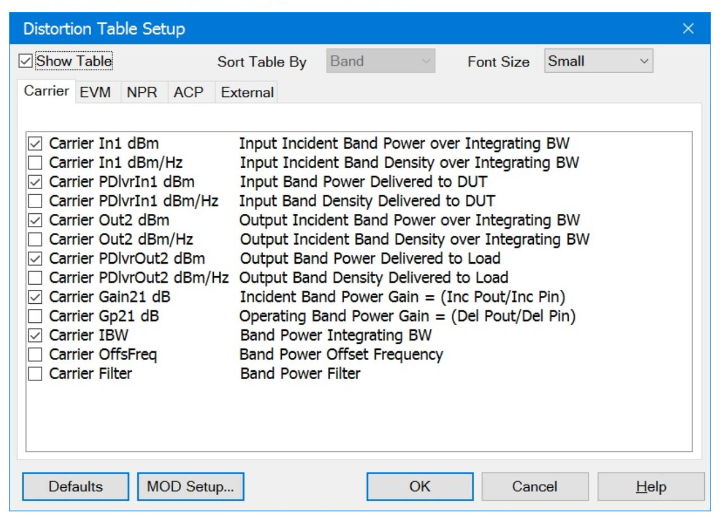
CarrIn1 |
Incident Band Power In on the DUT input. |
dBm/Hz |
|
|
CarrOut2 |
CarrOut2 |
Incident Band Power Out on the VNA test port at the DUT output. |
dBm/Hz |
|
CarrGain21 |
CarrGain21 |
Incident Band Power Gain = (Incident Pout)/(Incident Pin) |
dB |
|
CarrGp21 |
CarrGp21 |
Operating Band Power Gain = (Delivered Pout)/(Delivered Pin) |
dB |
|
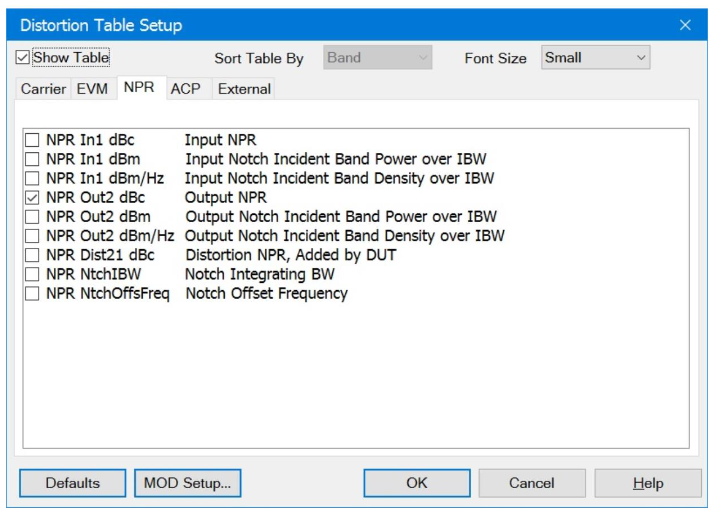
NprIn1 |
NprIn1 |
For dBc: NPR at Input For dBm: Notch input Band Power Incident on DUT. |
dBc |
|
NprOut2 |
NprOut2 |
For dBc: NPR at Output For dBm: Notch output Band Power incident on VNA port at DUT output. |
dBc |
|
NprDist21 |
NprDist21 |
NPR distortion added by DUT. |
dBc |
|
NprPwrIn1 |
NprPwrIn1 |
NPR Input Band Power Incident at the DUT input. |
dBm/Hz |
|
NprPwrOut2 |
NprPwrOut2 |
NPR Output Band Power incident on the VNA test port at the DUT output. |
dBm/Hz |
|
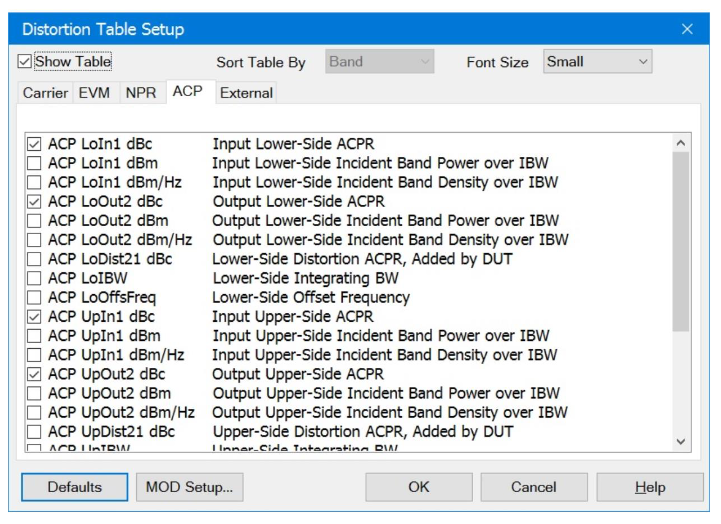
AcpIn1 |
AcpIn1 |
Ratio of in-band channel power to channel power of the adjacent channel band at the input |
dBc |
|
AcpLoIn1 |
AcpLoIn1 |
For dBc: ACPR low-side at input For dBm: Input Incident low-side power over IBW. |
dBc |
|
AcpUpIn1 |
AcpUpIn1 |
For dBc: ACPR upper-side at input For dBm: Input incident high-side power over IBW |
dBc |
|
AcpAvgIn1 |
AcpAvgIn1 |
For dBc: ACPR linear average at input For dBm: Input incident power over IBW. |
dBc |
|
AcpOut2 |
AcpOut2 |
Ratio of in-band channel power to channel power of the adjacent channel band at the output |
dBc |
|
AcploOut2 |
AcploOut2 |
For dBc: ACPR low-side at output For dBm: Output Incident low-side power over IBW. |
dBc |
|
AcpUpOut2 |
AcpUpOut2 |
For dBc: ACPR upper-side at output For dBm: Output incident high-side power over IBW |
dBc |
|
AcpAvgOut2 |
AcpAvgOut2 |
For dBc: ACPR linear average at output For dBm: Output incident power over IBW. |
dBc |
|
AcpDist21 |
AcpDist21 |
ACP distortion added by DUT. |
dBc |
|
AcpLoDist21 |
AcpLoDist21 |
ACPR low-side distortion |
dBc |
|
AcpUpDist21 |
AcpUpDist21 |
ACPR upper-side distortion |
dBc |
|
AcpAvgDist21 |
AcpAvgDist21 |
ACPR linear average distortion |
dBc |
|
AcpPwrIn1 |
AcpPwrIn1 |
ACP Input Band Power incident on the DUT input. |
dBm/Hz |
|
AcpPwrOut2 |
AcpPwrOut2 |
ACP Output Band Power incident on the VNA test port at the DUT output. |
dBm/Hz |
|
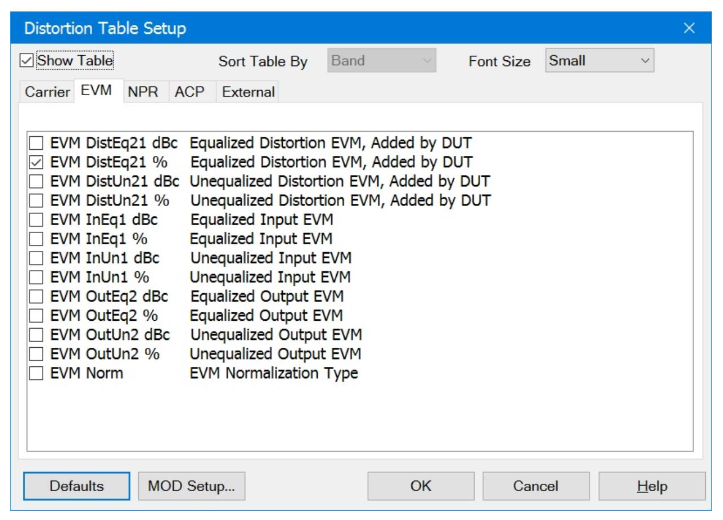
EvmDistEq21 |
EvmDistEq21 |
EVM equalized distortion added by DUT (non-linear contribution) |
% |
|
EvmDistUn21 |
EvmDistUn21 |
EVM unequalized distortion added by DUT (includes non-linear and linear distortion due to frequency dispersion) |
% |
|
EvmPwrIn1 |
EvmPwrIn1 |
EVM Input Band Power incident on the DUT input. |
dBm/Hz |
|
EvmPwrOut2 |
EvmPwrOut2 |
EVM Output Band Power incident on the VNA test port at the DUT output. |
dBm/Hz |
|
ModFilter |
ModFilter |
Modulation filter used during measurement |
dB |
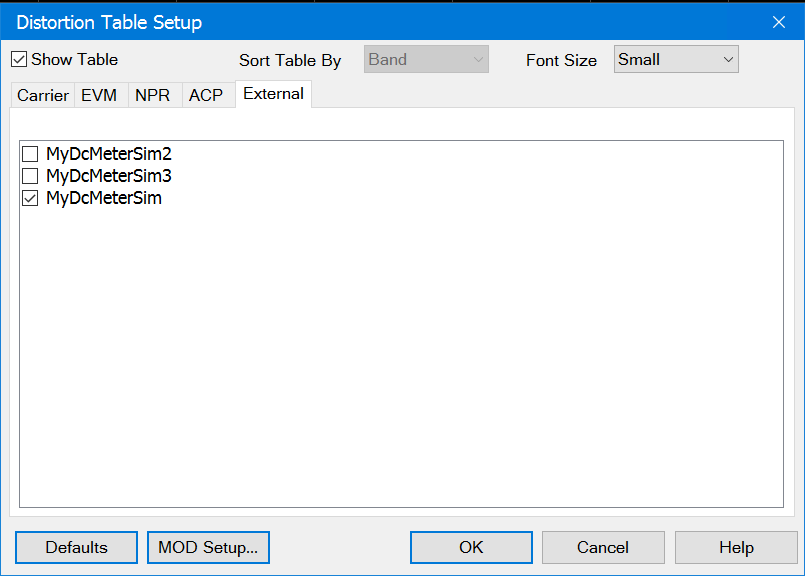
List DC Meters and SMUs that are defined in External Device Configuration.
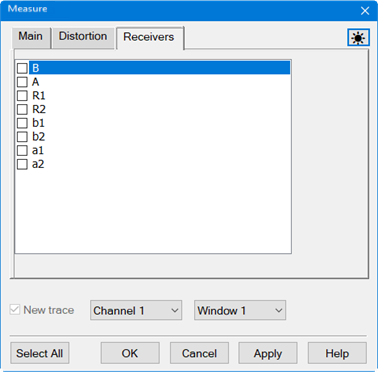
Only list the receivers for which Active-Show in UI is enabled.
For Sweep type set to Fixed, the trace will display a constant level.
For Sweep type set to Power, the trace will display multiple measurements versus an X-axis labeled as power.
Right-clicking on the dialog accesses a pop up menu. Select Show Expert Tabs to display the Receivers tab for selecting one of the VNA receivers:

The Distortion Table is displayed below the measurement area. Each row represents a measurement band. Each column represents a measurement parameter.

Total EVM
If there is more than one EVM band, then an extra band labeled Total EVM is added at the bottom of the table. The band power column sums the band power. The EVM and power density columns are a weighted average. The columns that do not apply are blank (for example, Carrier Offset Frequency).
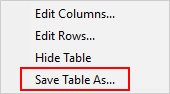
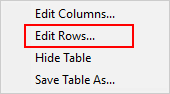
Saving the Distortion Table
The Distortion Table can be saved to a .csv file in one of three ways:
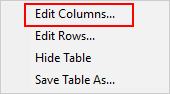
Accessing Distortion Table |
|
|
Using Hardkey/SoftTab/Softkey |
Using a mouse |
|
|
|
Distortion Table help |
|
Save Table As...Specifies the Modulation Distortion Table path and file name (*.csv). |
|