In this topic:
Spectrum Analyzer Option S93090xA/B
2- or 4-Port PNA with ability to connect an external modulated source
Supported external sources:
E8267D PSG Vector Signal Generator
M8190A with E8267D PSG Vector Signal Generator
M9383A MCS (wideband vector, 44 GHz, with enhanced phase noise)
N5182B MXG RF Vector Signal Generator
N5192A and N5194A UXG Vector Adapter
See All Spectrum Analyzer Examples
NPR measures the nonlinear behavior of an RF microwave amplifier under a modulated signal stimulus.
In this example, a setup file consisting of a multi-tone signal with a "notch" is created, uploaded to a signal generator, then fed into the VNA to test the behavior of the device. The "notch" refers to a small part of the frequency axis (up to 10% of the frequency span) that is forced to 0 (no signal) creating a notch in the power spectral density.
NPR is the sum of all intermodulation products across the pass band ratioed with the sum of all intermodulation products in the notch.
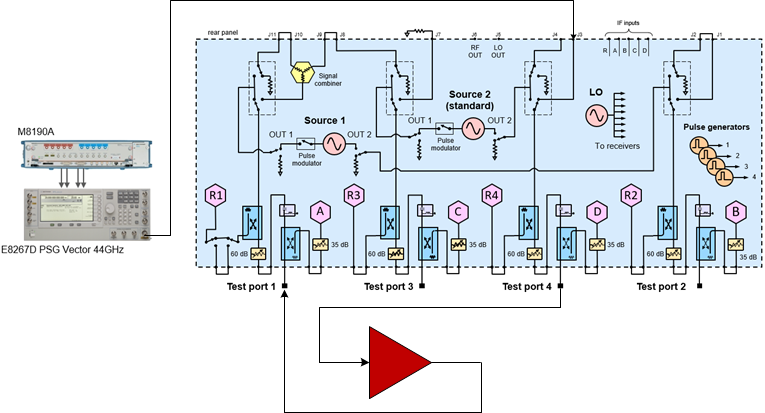
The following diagram shows a typical hardware setup using an M8190A with a E8267D PSG with the signal connected to the VNA rear-panel Port 1 J10 input connector.
Connect the equipment as shown above.
On the PNA front panel, press Preset.
On the VNA front panel, press Meas > S-Param > Meas Class....
Select Spectrum Analysis, then either:
OK delete the existing measurement, or
New Channel to create the measurement in a new channel.
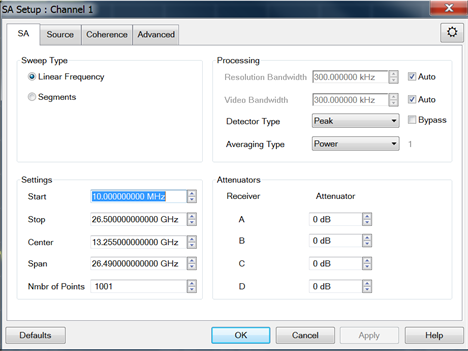
The SA Setup dialog will be displayed.
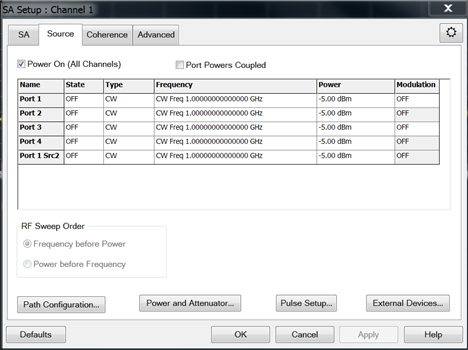
Click on the Source tab. The Source dialog will be displayed.
If you need
to add an external source, click on the External
Devices... button. Learn
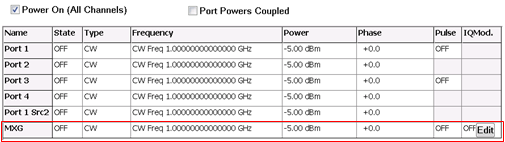
more. After adding an external source, it should be listed in
the Name column. The following
is an example showing a modulation source called MXG.
If the external source does not have modulation capabilities, the
IQMod column will be grayed
out.
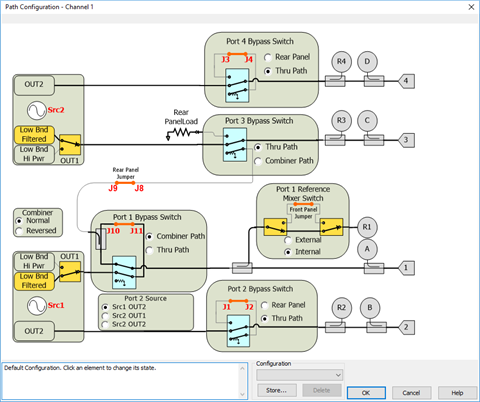
Click on the
Path Configuration... button
and ensure that the correct RF path is selected according to the Physical
Setup then click OK. For this
example, the Combiner path for Port 1 is selected since the modulated
signal is connected to the rear-panel J10 connector.
Click in the State field of your external source to change the state to ON.
Click in the Frequency field of your external source to change the frequency.
Click in the Power field of your external source to change the power.
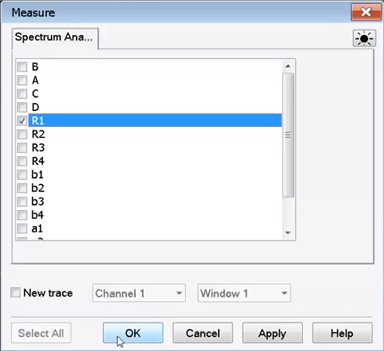
Ensure that
the appropriate reference receiver (signal at input of DUT) or test
port receiver (signal at output of DUT) is selected based on the Physical
Setup.
Click in the IQMod column for your external source and select Edit (refer to step 7 dialog example above) to access the Modulation settings dialog.
Click on the
Create/Edit Mod File... button
to access the Create Modulation
dialog.
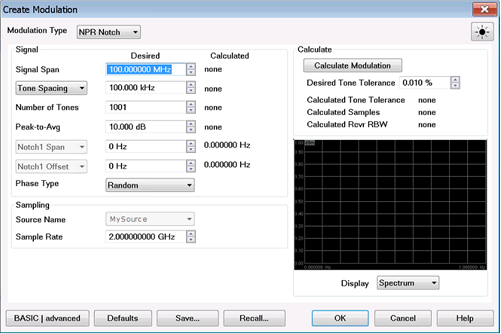
Click on the Source Name drop-down menu to select the source connected to the VNA that will be used to generate the modulated test signal.
Enter the span of the modulation signal in the Signal Span field.
Enter the tone spacing for the multi-tone signal in the Tone Spacing field.
The Number of Tones corresponds to the span and tone spacing. This value will be calculated when you click on the Calculate button.
Enter the span of the notch in the Notch1 Span field. The notch can be up to 10% of the span.
In the Notch Location drop-down menu, select Symmetric to position the notch in the center.
Click on the Calculate button to view the signal.
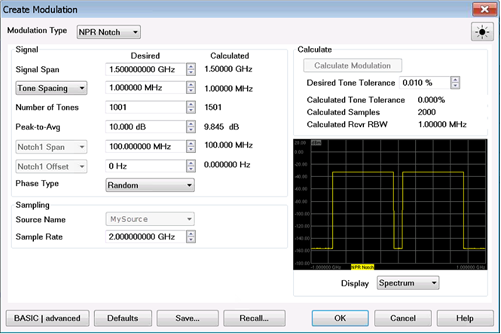
When the signal setup is complete, click on the Save... button to save this setup to a *.mdx file.
Click on the
OK button to return to the
Modulation settings dialog.
The file path and name are displayed in the Modulation
Filename field.
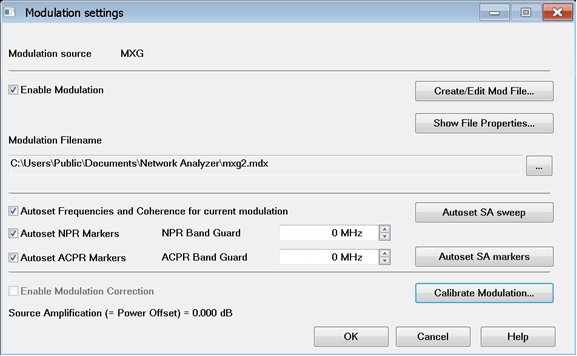
Check the Enable Modulation check box.
The Autoset Frequencies and Coherence for current modulation and Autoset Markers for the current modulation are checked by default. These options automatically adjust the spectrum analyzer frequency and spectrum analyzer markers each time adjustments are made to the modulation settings.
Click on the OK button to close the dialog. The following is an example signal:
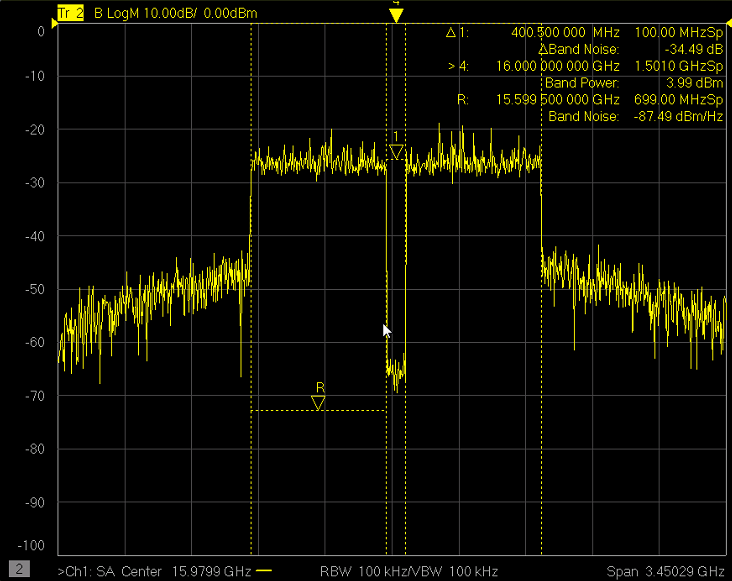
Markers
The ∆ 1 marker displays the notch frequency relative to the center frequency. In this example the notch is in the center so the frequency is 0 Hz. Also displayed is the notch marker power level.
The ∆Tone is the difference between the average tone power a the Reference (> R) marker and the average tone power at the bottom of the notch. This marker is accessed by pressing Marker -> SA Analysis -> Band Density -> Tone.
The > R marker displays the center frequency (16 GHz) and the signal span (1.5 GHz).
The Band Power displays the total power within the signal span.
The Tone(1.40 GHz) displays the average tone power across the 1.5 GHz signal span minus the average tone power across the notch (1.5 GHz - 100 MHz = 1.4 GHz).
To learn more about these markers, refer to SA Analysis Markers.
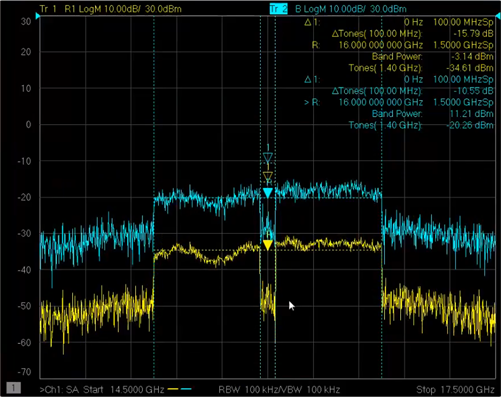
To view the signal at the output of the DUT, add a new trace and select the B test port receiver since the output of the DUT is connected to port 2.
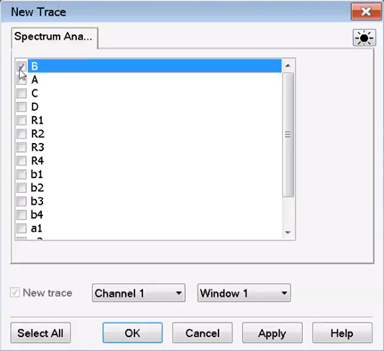
The following
is an example. The blue trace is the signal at the output of the DUT.
The Modulation Cal procedure optimizes the signal across the pass band and the depth of the notch.
Click on the SA Setup... button to open the SA Setup dialog then select the Source tab.
Click in the
IQMod column for your external
source and select Edit to
access the Modulation settings
dialog.
Click on the Calibrate Modulation... button. The Modulation Cal - Setup dialog is displayed.
Select Power to calibrate power across the entire pass band.
Select Flatness to calibrate flatness across the entire pass band.
Select NPR Notch to create as deep a notch as possible.
Under Calibrate At, select Rcvr R1 for Power Cal, Flatness Cal, and NPR Notch Cal. This will perform a calibration at the input of the DUT.
The default values for Max Nmbr Iterations and Desired Tolerance will be used.
Click Next. The following dialog is displayed.
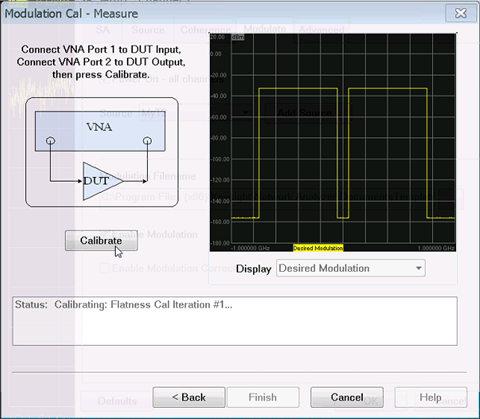
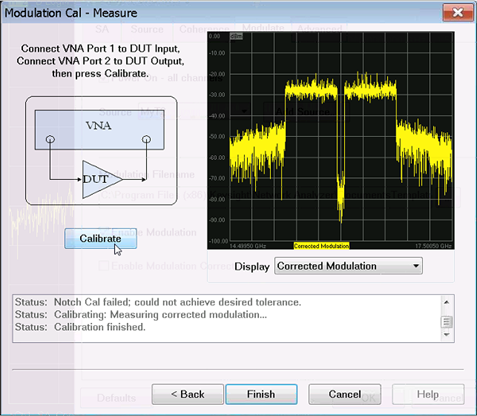
Click Calibrate to begin the calibration. When finished, the corrected modulated signal is displayed.
Click on the
Finish button then click on
the Save & Exit button
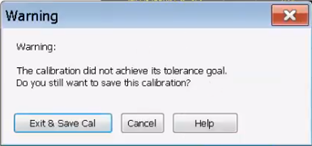
to save the file. If
one or more of the default tolerance values could not be achieved,
a warning message is displayed. You have the option to change the
tolerance values and re-calibrate or save the current calibration.
In the Modulation Cal - Measure dialog,
note that the failed calibration is indicated in the text box.
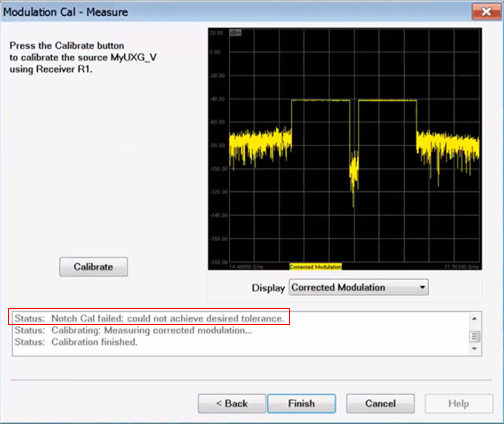
In the Modulation settings dialog, Enable Modulation Correction is automatically checked if the user exits the wizard with Exit & Save Cal.
Click OK.
The following
shows an optimized input signal.
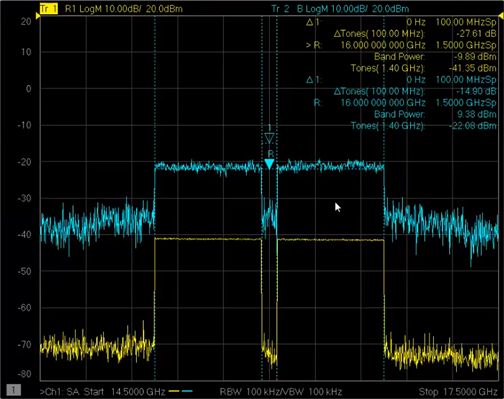
We can now see the Power Amplifier DUT output NPR (blue trace -14.90 dB) and still monitor the NPR at the DUT input (yellow trace -27.61 dB here).