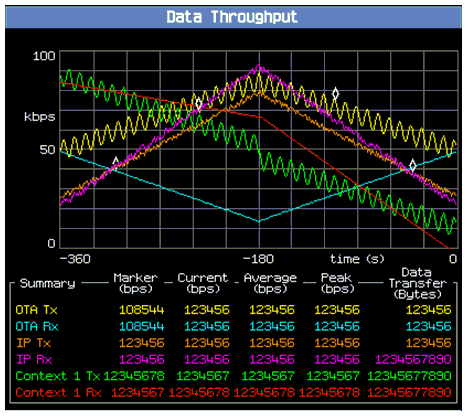
Data Throughput Monitor Description
This section is only applicable to the lab application.
Description
What is Data Throughput?
The Data Throughput Monitor can analyze data transfer rates under various RF and call processing conditions. You can initiate the Data Throughput Monitor by pressing the
Instrument selection
key. It is displayed on the
Measurement/Instrument
screen (accessible using the
MEASUREMENT
key).
Data throughput is the rate of data transfer to and from a wireless device.
This feature does not attempt to monitor application layer data throughput (FTP, HTTP, TELNET, etc.).
Two sets of statistics are available from the Data Throughput Monitor:
-
OTA Rx and OTA Tx
OTA (Over the Air) throughput counts the data transmitted and received by the test set's protocol stack. The location of the measurement point in the protocol stack is dependent upon system type; this data could be a byte stream from RLP (Radio Link Protocol) or RLC (Radio Link Control) or PPP (point to point protocol). OTA throughput does not count physical layer overhead such as mid-amble, guard, or tail bits, or bits added by the encoding process.
-
IP Rx and IP Tx
IP (Internet Protocol) throughput counts the data transmitted and received by the test set. It measures the IP data transferred between the external LAN connector and the protocol stack. It provides a measure of the IP data packets being transferred to/from the wireless device.
How is Data Throughput Displayed?
When the Data Throughput Monitor is selected and a data call is connected, the test set accumulates data throughput statistics. If a data call is disconnected, data accumulation is suspended until another connection is made and data accumulation continues. Data accumulation can be cleared by performing a measurement reset or clearing the graph.
The test set provides two tools to analyze data throughput:
Graphical trace
The graphical trace presents up to the most recent 600 seconds (10 minutes) of data throughput statistics. Each of the following color-coded traces can be turned on or off:

- OTA Tx - (Over The Air Transmitted bits-per-second). This is the rate of link-layer bit transfer sent from the wireless device. In other words, OTA translates into RLP (Radio Link Protocol) in cdma2000 and 1xEV-DO, or RLC (Radio Link Control) protocol in W-CDMA and GPRS, or PPP in GSM. Tx refers to the reverse or uplink channel direction.
- OTA Rx - (Over The Air Received bits-per-second). This is the rate of link-layer bit transfer received by the wireless device. In other words, OTA translates into RLP (Radio Link Protocol) in cdma2000 and 1xEV-DO, or RLC (Radio Link Control) protocol in W-CDMA and GPRS, or PPP in GSM. Rx refers to the forward or downlink channel direction.
- IP Tx - Internet Protocol Transmitted. This is the rate of network-layer bit transfer sent by the wireless device. Tx refers to the reverse or uplink channel direction.
- IP Rx - Internet Protocol Received. This is the rate of network-layer bit transfer received by the wireless device. Rx refers to the forward or downlink channel direction.
- Context 1 Tx - Internet Protocol Context 1 Transmitted. This is the rate of context 1 network-layer bit transfer sent by the wireless device. Tx refers to the reverse or uplink channel direction.
- Context 1 Rx - Internet Protocol Context 1 Received. This is the rate of context 1 network-layer bit transfer received by the wireless device. Rx refers to the forward or downlink channel direction.
For WCDMA applications that have the required Dual Cell HSDPA license, there are three OTA Rx results available: OTA Rx (for the serving cell), OTA2 Rx (for the secondary serving cell) and OTA Rx Total (for the two cells combined). Accordingly you can enable any of the OTA Rx traces.
Four sets of Context <n> traces can be set: Context 1 Tx/Rx, Context 2 Tx/Rx, Context 3 Tx/Rx and Context 4 Tx/Rx. Totally there are 12 traces results are available form the Data Throughput Monitor, but six of them can be display on the screen at one time. The users can choose which traces are to be displayed by pressing
Trace Display
softkey.
Note that for an application that dose not support counters for multiple Contexts, the "Context<n>" counts will always be zero (a trace will still be available but every point will be "0").
A marker can be assigned to each trace to display instantaneous numeric data throughput values. Markers can be used in conjunction with the Freeze Graph feature to analyze points of interest on traces.
Summary table
The summary table provides the latest statistics for the four monitored measurements. Each measurement is displayed with the following statistics:

-
Marker
The data rate at the measurement's marker position in bits-per-second.
-
Current
-
Average
The measurement's average data rate in bits-per-second over the length of the data connection or since the last time the measurement was cleared.
-
Peak
The measurement's peak data rate in bits-per-second over the length of the data connection or since the last time the measurement was cleared.
-
Data Transfer
The measurement's total data throughput count, in bytes, over the length of the data connection or since the last time the measurement was cleared