How Do I Use the Data Throughput Monitor?
Last updated: January 15, 2009
This section is only applicable to the lab application.
Description
The following procedure illustrates typical usage of the data throughput monitor.
Accessing the Monitor Controls
- Press the Instrument selection key.
-
Select
Data Throughput Monitor.
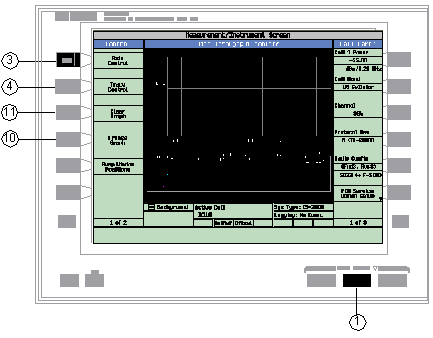
The data throughput monitor is displayed with the default settings as shown above. TheSwap Window Positions( F5 )Once the data throughput monitor is selected, it can be accessed by pressing the MEASUREMENT key, followed by the
Swap Window Positions( F5 ) -
Set the axis control as needed for your testing situation using the
Axis Control( F1 )key to access theTime Span( F1 ),Start Data Rate( F2 )Stop Data Rate( F3 ) -
Press the
Return( F6 )Axis Controlmenu. -
Select the traces you would like to display by pressing the
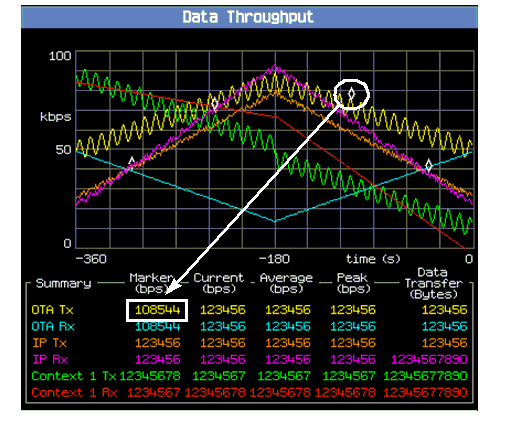
Trace Control( F2 ) key followed by theTrace Display( F1 ) key. To select a trace, turn the value to On. There are six color-coded traces and any combination can be selected:- OTA Tx - (Over The Air Transmitted bits-per-second). This is the rate of link-layer bit transfer sent from the wireless device. In other words, OTA translates into RLP (Radio Link Protocol) in cdma2000 and 1xEV-DO, or RLC (Radio Link Control) protocol in WCDMA and GPRS, or PPP in GSM. Tx refers to the reverse or uplink channel direction.
- OTA Rx - (Over The Air Received bits-per-second). This is the rate of link-layer bit transfer received by the wireless device. In other words, OTA translates into RLP (Radio Link Protocol) in cdma2000 and 1xEV-DO, or RLC (Radio Link Control) protocol in WCDMA and GPRS, or PPP in GSM. Rx refers to the forward or downlink channel direction.
- IP Tx - Internet Protocol Transmitted. This is the rate of network-layer bit transfer sent by the wireless device. Tx refers to the reverse or uplink channel direction.
- IP Rx - Internet Protocol Received. This is the rate of network-layer bit transfer received by the wireless device. Rx refers to the forward or downlink channel direction.
- Context <n> Tx - Internet Protocol Context 1 Transmitted. This is the rate of context 1 network-layer bit transfer sent by the wireless device. Tx refers to the reverse or uplink channel direction.
- Context <n> Rx - Internet Protocol Context 1 Received. This is the rate of context 1 network-layer bit transfer received by the wireless device. Rx refers to the forward or downlink channel direction.
By default, the OTA Tx and OTA Rx traces are the only traces turned on.
-
Press the
Return( F6 )Trace Controlmenu. -
Establish a data connection with the mobile.
The Data Throughput Monitor will begin displaying numerical and graphical information. The numerical information pertains to the period of time beginning with the establishment of the first data connection, and the graphical traces represent up to 600 seconds of the latest data throughput statistics.
-
Set a marker.
Using the Trace Control menu, select a marker by pressing the corresponding F2 , F3 , F4 , or F5 keys followed by the Data Entry key labeled ON.
After allowing the monitor to accumulate throughput for at least one minute, change the Time Span to 50 seconds (see step 3 above). This will expand the graphical view to improve resolution.
-
Freeze the graph.
Press the Freeze Graph (F4) key.
Turn the knob to adjust the position of the marker. Marker results will be displayed in the summary table

-
Press the
Return (
F6
)
key to exit theTrace Controlmenu. -
Press the
Resume Graph (
F4
)
key to display the most recent trace data. -
Press the
Clear Graph (
F3
)
key to reset the traces and the numeric counters.