Switching Locus
Switching locus represents the voltage and current combination (ID / VDS) along turn-on and turn-off. It is generally used to make sure the locus is within the Safe Operating Area (SOA) of a device.
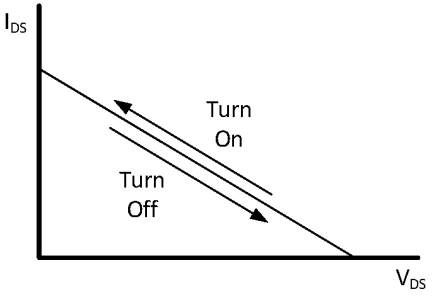
If the device has a resistive load, the locus is very simple -- essentially a straight line:
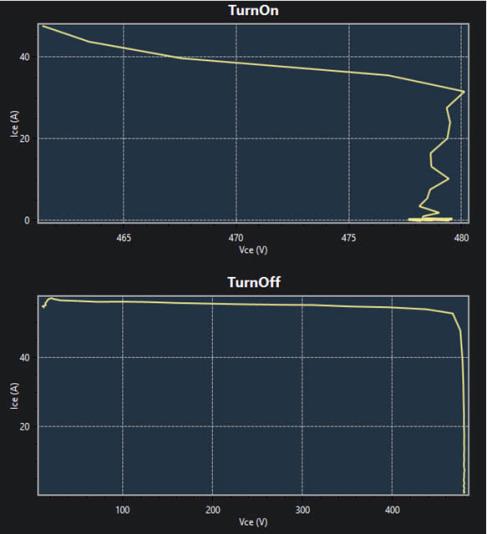
But for most power electronics applications, the circuit has an inductive load. This makes the switching locus more complex. With an inductive load, you don’t know how the voltage and current combination moves along the switching cycle. Also, the locus actually changes after some stress. Sometimes, the switching locus is measured while stressing the DUT.
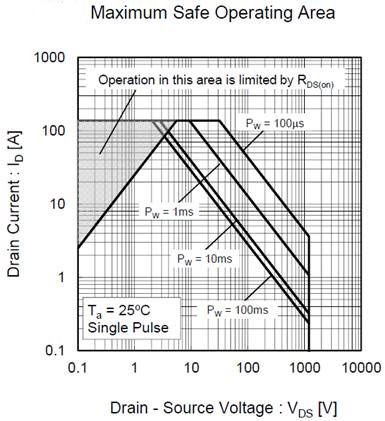
By seeing the switching locus and comparing it against SOA curve, a user can make sure the circuit works reliably. Figure below is an example SOA curve taken from a data sheet.

As you can see, this also plots ID against VDS just like the Switching Locus Plots.
Switching locus does not follow a standard. It shows output current over output voltage during the switching periods. The switching locus can be generated for any power transistor and the algorithm is independent from semiconductor material or device topology.
Legacy software algorithm
For turn on the output voltage/current values between switching start and end are used. For turn off, from switching start to 2 % of the output current. At the end, the points for each (turn on and off) are reduced to a maximum of 100 points by averaging.
IEC 60747 software algorithm
For turn-off:
- Starts when the output voltage starts changing
- Stops when output current stops changing
For turn-on:
- Starts when the output current starts changing
- Stops when output voltage stops changing
The switching locus for turn-on and turn-off starts and stops at 0, unless there are no measured values close to 0. In this case, warnings are written to the log file.

