Line Chart 
The line chart shows measurement data with amplitude, frequency, or temperature as the vertical axis (y-axis) and relative time as the horizontal axis (x-axis).
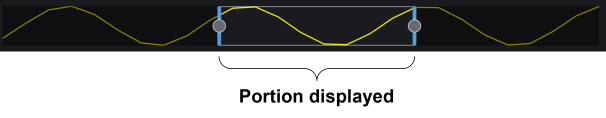
Data Preview Bar
The Data Preview Bar gives a visual indication of the portion of the trace that is currently displayed in the chart. The area within the blue vertical lines is the portion of the trace that is currently displayed.
Use Trace Display Toolbar to zoom in/out and auto scale the displayed data.