Levels Metrics (Advanced-Radar/Hopping)
Menu Path:
This topic describes the Levels metrics displayed in the Pulse Table.
-
Top Level (dBm deciBels referenced to a milliWatt: dB relative to 1 milliwatt dissipated in the nominal input impedance of the analyzer)
-
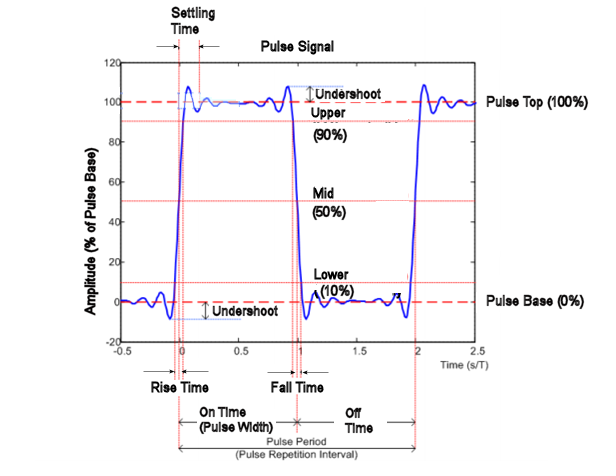
The most positive state within the measurement span. The value of this parameter is used as a reference (100%) to determine other parameter values such as the rising / falling thresholds. The high state level is selectable as the mode or mean of the histogram with the mode used as the default.
-
Measured Top Level (dBm) reports per pulse amplitude ON power level measured over ON + OFF time.
-
Measured method is either “Mode”, “Median” or “Mean” as determined by user selection of parameter Top/Base Calculation Method.
-
Measurements are based on IEEE Institute of Electrical and Electronics Engineers. A US-based membership organisation that includes engineers, scientists, and students in electronics and related fields. The IEEE developed the 802 series wired and wireless LAN standards. Visit the IEEE at http://www.ieee.org Std 181-2011, where bi-modal histogram is generated for each individual detected pulse.
-
The bi-modal histogram is then split into two sub-histograms representing pulse amplitude ON (Top) and Off (Base) regions.
-
Top and Base Levels are derived as either the Mode, Median or Mean levels from each of the respective pulse amplitude sub-histograms.
-
Detailed definition of supported Top Level measurement methods can be found under the Pulse Measurement's Top/Base Calculation Method property description.
-
-
-
The most negative state within a measurement span. The value of this parameter is used as a reference (0%) to determine other parameter values such as the rising / falling thresholds.
-
Measured Base Level (dBm) reports per pulse amplitude OFF power level measured over ON + OFF time.
-
Measured method is either “Mode”, “Median” or “Mean” as determined by user selection of parameter Top/Base Calculation Method.
-
Measurements are based on IEEE Std 181-2011, where bi-modal histogram is generated for each individual detected pulse.
-
The bi-modal histogram is then split into two sub-histograms representing pulse amplitude ON (Top) and Off (Base) regions.
-
Top and Base Levels are derived as either the Mode, Median or Mean levels from each of the respective pulse amplitude sub-histograms.
-
Detailed definition of supported Base Level measurement methods can be found under the Pulse Measurement's Top/Base Calculation Method property descriptions.
-
-
-
The measured Top/Base (dB) amplitude ON/OFF level ratio expressed as dB ratio per pulse measured over ON + OFF time. Top/Base (dB) = Top Level (dBm) - Base Level (dBm)
-
-
-
The average amplitude of the individual pulse during the interval when the pulse is on as compared to Average which is the average amplitude over the entire pulse cycle, including the off time until the next pulse begins.
-
The measured Freq/Phase/Chirp Mode reports the mode value (i.e. the more commonly occurring value) across the ON portion of the region.
-
-
-
The maximum amplitude of the pulse.
-
The measured Peak Level (dBm) reports per pulse peak power level measured over ON + OFF time.
-
-
-
The average amplitude over the entire measurement record.
-
The measured Mean Level (dBm) reports per pulse average pulse power measured over ON + OFF time.
-
-
-
The ratio of peak amplitude to average amplitude.
-
The measured Peak To Average (dB) reports per pulse peak power level over pulse average pulse power measured over ON + OFF time.
-
Peak to Average (dB) = Peak Level (dBm) – Mean Level (dBm)
-

