Stop Frequency (Frequency)
The frequency is the end (highest) frequency of the frequency band to analyze. For information on other ways to set the Frequency, see Changing Frequency Settings.
The maximum frequency that the VSA can measure is determined by the measurement hardware.
The following picture shows stop frequency as compared to the other frequency parameters:
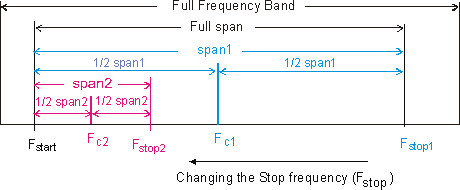
When the frequency is changed, the VSA changes the and frequencies, but does not change the frequency, except in these two cases:
- If a frequency is specified that yields an invalid span, the VSA changes the frequency to maintain a valid span.
- If a frequency is specified that is less than the frequency, the VSA changes the frequency to achieve a valid minimum span.
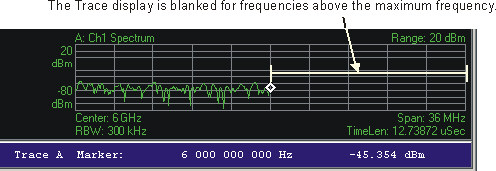
Display Limits for (Trace Blanking)
It is possible to select a frequency that results in a negative frequency. It is also possible to specify a frequency that exceeds the VSA's frequency range.
If a frequency that results in a negative start frequency is specifed, there will not be anything displayed to the left of the minimum frequency. For example, if the frequency range of the VSA is 0 to 39 MHz Megahertz: A unit of frequency equal to one million hertz or cycles per second. and a frequency that yields a negative frequency is specified, there will not be anything displayed to the left of 0 Hz. This is called Trace Blanking.
Likewise, if a frequency above the VSA's frequency range is specified, there will not be anything displayed to the right of the maximum frequency. In the previous example, there will not be anything displayed to the right of 39 MHz.
Start frequency limitations with 2-channel I+jQ(Ch1+j*Ch2) input mode
For information and when using dual channel I+jQ(Ch1+j*Ch2) input mode, see I+jQ Span and Frequency.
Using "Show All Points"
Use the Show All Points parameter ( tab) to view the blanked trace data. The parameter displays frequency data even if it extends beyond the VSA’s standard frequency and valid data range. The data may contain alias products, so use caution when selecting this parameter.
See Also