RB Power Time (LTE)
shows the resource block power for each slot in the time interval specified by Measurement Interval and Measurement Offset. For trace formats that show magnitude, multiple power values are plotted above each slot index on the x-axis. Each point represents the power of a particular resource block in the measurement interval. The distance away from the x-axis expresses the power.
The trace is different from the other traces in that
- channel frequency response equalization has not been applied
- non-alloc resources are included whether or not Non-Alloc has been selected on the Profile tab of the LTE Demod Properties dialog box
Slot numbering starts from 0 at the beginning of a frame.
The data in this trace is generated from the 2D IQ Meas data (frequency x time) grouped into into resource blocks (12 subcarriers x 1 slot). The powers of the resource elements are summed for each resource block, and the resulting resource block powers are plotted for each slot along the time axis. To view the resource block powers plotted according to frequency, use the RB Power Spectrum trace.
For downlink signals, PDSCH Physical Downlink Shared Channel IQ data used in calculating this trace comes from the layer chosen when selecting this trace. Other LTE Long Term Evolution channels/signals are included in Layer traces for convenience. For more details, see the Layer Traces and Resource Element Distribution topic.
For uplink signals, the IQ data comes directly from the OFDM Orthogonal Frequency Division Multiplexing: OFDM employs multiple overlapping radio frequency carriers, each operating at a carefully chosen frequency that is Orthogonal to the others, to produce a transmission scheme that supports higher bit rates due to parallel channel operation. OFDM is an alternative tranmission scheme to DSSS and FHSS. symbol FFT Fast Fourier Transform: A mathematical operation performed on a time-domain signal to yield the individual spectral components that constitute the signal. See Spectrum., except for PUSCH Physical Uplink Shared Channel. PUSCH subcarriers are despread before being used in calculations.
The marker shown on the trace below
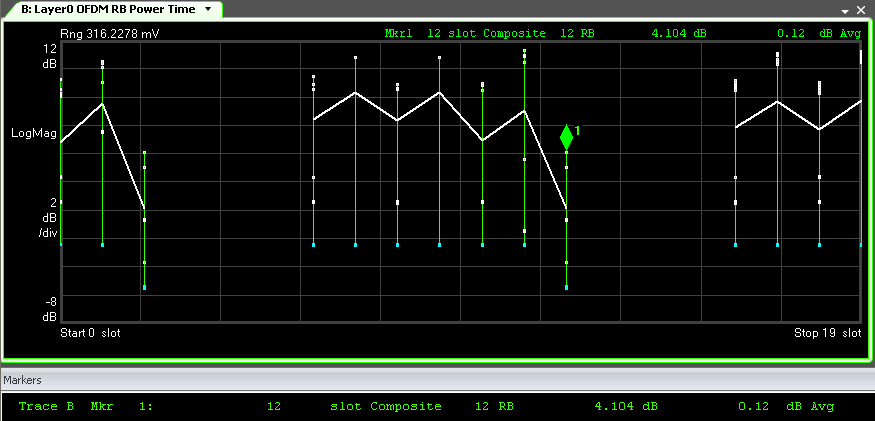
indicates that
- the marker is at slot 12 in time
- the power of the resource block is a composite of several channel allocations (see Composite Include)
- the marker is on the resource block 12 (RB Resource Block 0 is the farthest left RB in frequency)
- the resource block has an RMS power of 4.104 dB (for downlink, 0 dB is determined by RS Power Boost; and for uplink, 0 dB is determined by the power setting of the channel selected for Sync Type)
- the average power of all resource blocks in slot 12 is 0.12 dB
Points on the trace are colored to represent the channel/signal they contain. When a resource block contains more than just one channel/signal (which is often the case unless some channels are turned off in Composite Include), the point will be colored white and a marker on the point will be labeled "Composite".
You can disable the average line for this trace by clearing the check box.
When the average line is disabled, the marker will not display the average value for the current marker location.
See Also