ACPR Testing (MB-OFDM)
Adjacent Channel Power Ratio testing (ACPR Adjacent Channel Power Ratio - A measurement of the amount of interference, or power, in the adjacent frequency channel. ACPR is usually defined as the ratio of the average power in the adjacent frequency channel (or offset) to the average power in the transmitted frequency channel. ACPR is a critical measurement for CDMA transmitters and their components. It describes the amount of distortion generated due to nonlinearities in RF components. The ACPR measurement is not part of the cdmaOne standard.) measures the ratio of the in-band signal power to the out-of-band signal power. ACPR indicates the transmitters potential for interfering with an adjacent band. For example, a Mid band interfering with a Low or High band.
Adapt the following example to your ACPR testing.
- Start the VSA.
- Recall a test signal: .
- Recall a test setup: .
- Start recording: (recording pauses after running).
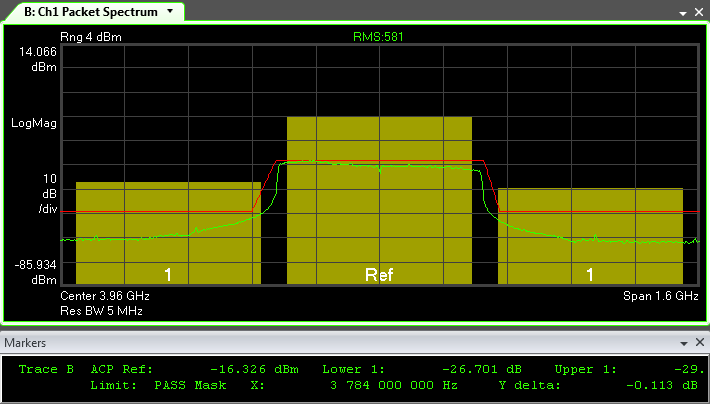
- Note traces and in particular , which displays ACPR values at bottom of screen.
- Recall first spectral mask limit test: . Repeat to load the remaining spectral
limit tests (below).
Spectral Limit Tests
Test
TFC Transport Format Combination Description
WiMediaPSDMaskHigh.lims
TFC 1 to 4, High.
WiMediaPSDMaskLow.lims
TFC 1 to 4, Low
WiMediaPSDMaskMid.lims
TFC 1 to 4 and 6, Mid
WiMediaPSDMaskTFC5.lims
TFC 5, Low.
WiMediaPSDMaskTFC7.lims
TFC 7, High.
- Display the limit lines on the spectrum using: , where [limit] is from a pull-down list of available tests. For this example, .
- Observe the limits line on the spectrum display meets the -20dB specification for adjacent bands.
Display
The test signal for the following example is for a Time-Frequency Code (TFC) = 6, that is, a non-hopping Band 2 (Mid) signal. The most meaningful spectral mask limit test, therefore, uses the WiMediaPSDMaskMid limits, which displays any spectrum problems for the adjacent Band Low and Band High spectral portions (below).
The trace Resolution Band Width (RBW Resolution Band Width (RBW or ResBW): specifies the minimum frequency bandwith that two separate frequency spectra can be resolved and viewed seperately. For FFT (digital) based VSA's the process is equivalent to passing a time-domain signal through a bank of bandpass filters, whose center frequencies correspond to the frequencies of the FFT bins. For a traditional swept-tuned (non-digital) spectrum analyzer, the resolution bandwidth is the bandwidth of the IF filter which determines the selectivity.) depends on your setting of the parameter Packet Avg RBW, which has a default value of 5 MHz Megahertz: A unit of frequency equal to one million hertz or cycles per second.. The Center frequency of 3.960 GHz Gigahertz: A frequency measurement which equals one billion hertz. in this example represents the center frequency of Band 2 (Mid) in Band Group 1. The TimeLen is developed from your Packet Avg RBW setting.
See Also