This topic contains the following:
Graph drop-down with Spectrum shown and traces displayed in a stack.
Graph drop-down with Spectrogram shown and traces displayed in a stack.
See also, Monitor Graph - Spectrum, Spectrogram, and Cross Domain and TDoA Icons - Save as PNG, Zoom, and Reset Axis.
Graph drop-down with Spectrum shown and traces displayed in a stack.
Graph drop-down with Spectrogram shown and traces displayed in a stack.
Record and Start Record Buttons
Choose a Record time and a Record interval
Record time - This is the total time of the measurement's recording.
Record interval - This is the interval between sweeps.
Graph drop-down with Spectrum shown and traces displayed in a stack.
Graph drop-down with Spectrogram shown and traces displayed in a stack.
This topic contains the following:
See also, Monitor Graph - Spectrum, Spectrogram, and Cross Domain and Spectrum and Spectrogram Graph - Recording.
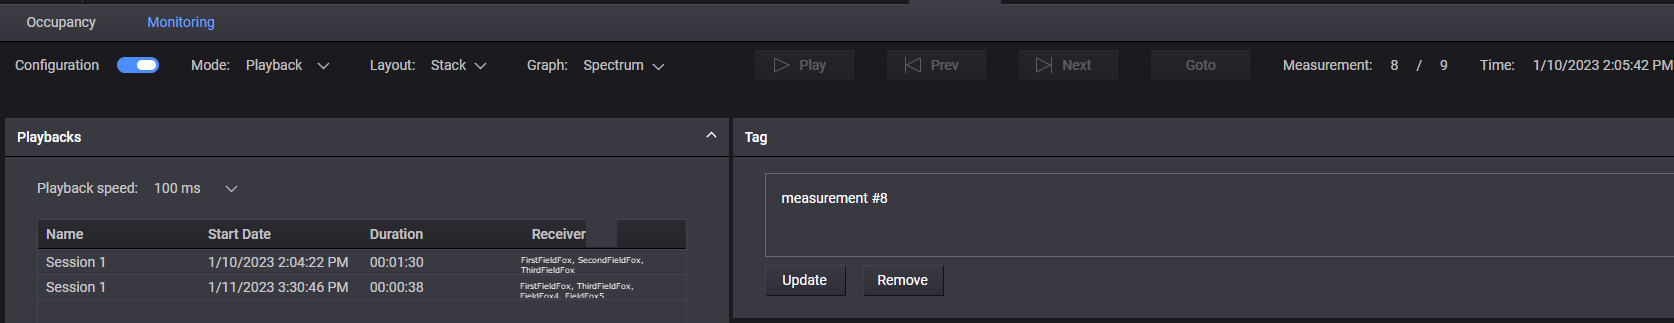
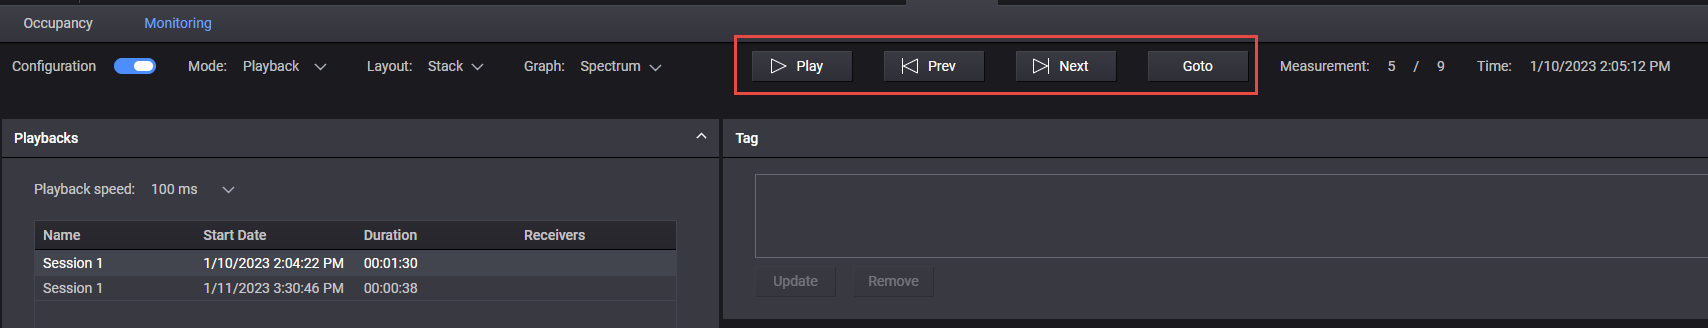
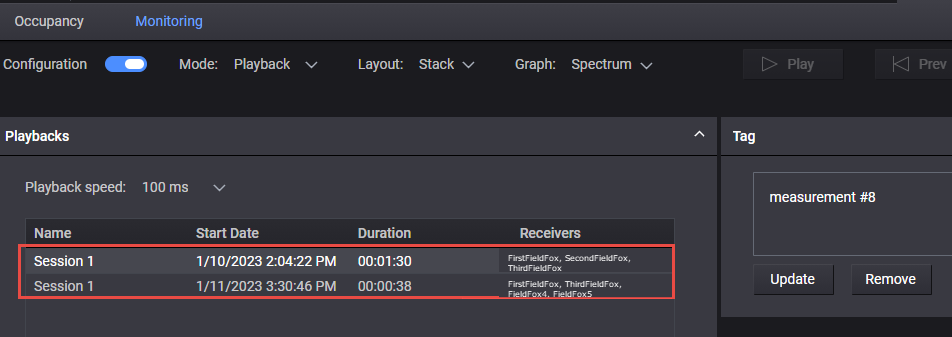
Choose a session(s) that has been recorded and click to play
"Session 1" and "Session 2" are examples. The playback filenames could be anything you choose. See Spectrum Monitoring - Playback Displays.
Click the Add ( ) button to choose up to four markers to the spectrum playback traces. See Playback, Prev, Next, and Goto Buttons.
After you click on a session the Play and Next buttons becomes active ( and
and  ).
).
After you click on a session the click the Play button ().
Optional:
If you select Previous or Next when playing a measurement the playback pauses.
Click Previous ( ) or Next (
 ) to select the previous or next trace in the measurement.
Click Goto ( ) to specify a specific trace to restart the playback point.
Spectrum Monitoring - Playback Displays
Playback, Prev, Next, and Goto Buttons