 (Configuration is enabled)
This screen displays the spectrum Receivers and Instrument Settings.
This section contains the following sections:
See also, Spectrum (Occupancy), Spectrum (Cross Domain) - UI, Spectrum and Spectrogram Graph - Record and Playback, and TDoA Icons - Save as PNG, Zoom, and Reset Axis.
Enables /disables the spectrum monitoring Receivers, Settings, and Spectrum Markers tabs to provide bigger view of the spectrum monitoring window.
(Configuration is enabled)
This section describes the monitoring mode choices.
Mode Monitoring Choices for a Spectrum
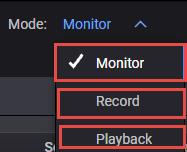
Monitor- displays trace for a single receiver
Record- records up to four traces of receivers for playback or future analysis
Playback- plays back the recorded receiver traces
This section describes the stack layout choices for a Spectrum measurement.
Layout Stack Choices for a Spectrum
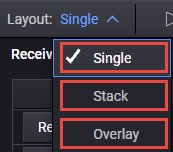
Single - single trace for a single receiver is displayed
Stack - the traces of up to four instruments is displayed
Overlay - two to four instrument traces are shown overlaid
Spectrum - Spectrum - Single, Spectrum - Stack, and Spectrum - Overlay trace is displayed
See also, Go to description.
Spectrogram - Spectrogram provides a visual history of the measured spectrum. This display type can be used to locate intermittent signals or to view signal levels and frequencies over time.
Cross Domain- Displays a specific time section of the spectrogram in time vs. power graph.
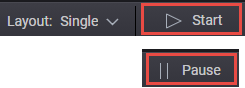
This section discusses the Start /Pause button features.
Starting and Pausing a Spectrum Measurement
You can collapse (close) and open a pane view to enable better viewing of the other tabs.
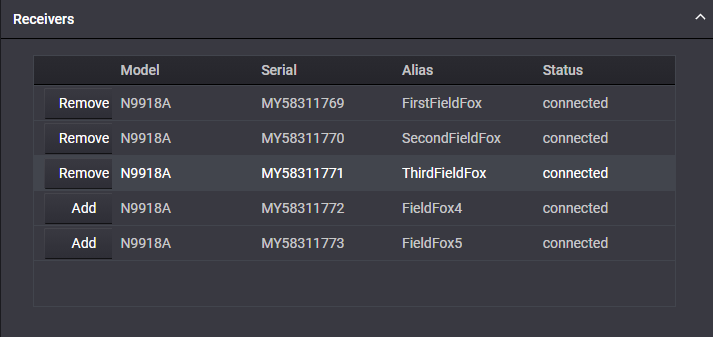
The list of spectrum receivers table lists the instrument Model, Serial number, and Alias (nickname), that the spectrum measurement uses to acquire the data. Refer to List of Receivers table.
Select one to four receivers to use in your Spectrum measurement.
List of Receivers table (Example)
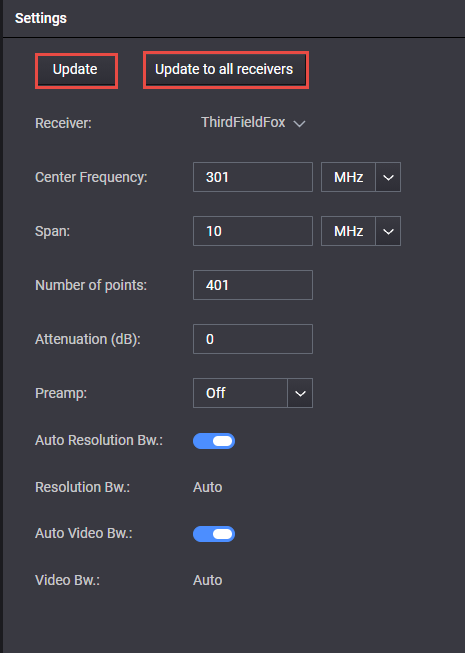
Displays a list of the Center Frequency, Span, Number of points, Attenuator (dB), Preamp, Auto Resolution Bandwidth (BW) On/Off, Resolution Bandwidth (BW) - (manual), Auto Video Bandwidth (BW) On/Off, and Video Bandwidth (BW) - Manual settings. An example is shown below. Refer to Instrument Settings.
Learn more, refer to your instrument's User's Guide on www.keysight.com.
Set each instrument's settings as required for your measurement setup.