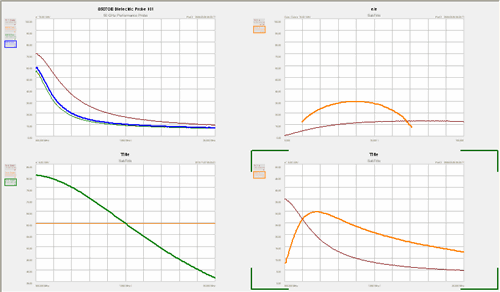
An unlimited number of charts (plots, graphs) can be displayed at the same time on the N1500A screen. There is always at least ONE chart present on the screen.

Four charts, each with multiple traces
The chart with the green [Brackets] is the Active (selected) chart.
To view a single chart in full-screen, double-click the chart.
To return to viewing all charts, again double-click on the single chart.
Right-click anywhere on a chart (NOT on a trace name) to make the following settings:
New Trace - Click, the select a new trace to display.
Autoscale All - Sets the scale so that one or all traces fit most of the chart depending on the Scale Coupling setting.
Reset Scale All - Return the scale of all traces to the original setting.
Scale Coupling - See Scale dialog help.
Scale - See Scale dialog help.
Marker - See Marker dialog help
Trace Math - See Trace Math dialog help.
Chart
New Chart - Creates a new chart window.
Delete Chart - Removes the chart (if it is not the only chart).
Copy - Copies the current chart and traces to the clipboard. The image can then be copied to an external program such as Microsoft Paint.
A trace is the display of the measured data points connected by a line. An unlimited number of traces can be displayed in a single chart to represent that data set. Channels recreate measurement setups in the instrument when a new measurement is required.
To compare measured data sets from the same port, save one of the traces to memory. Learn how.
Each trace in a chart can be the result of a unique or duplicate measurement or equation.
Each trace can have unique Scale and Markers.
The date and time the measurement was made appears in the top right corner of the chart.
Trace Names
|
|
Trace names appear to the left of the chart. The trace with the box around the Tr name is the Active (selected) trace.
|
Right-click on a trace name to make the following Trace settings:
Format - Change the measurement for the active trace.
Format All - Change the measurement for ALL traces in the chart.
Autoscale - Change the scale of the trace to fit in the chart. See Scale Coupling to determine which traces are scaled.
Reset Scale - Change to the original scale for the chart.
Scale - Start the Scale dialog.
Rename - Change the trace name.
Delete - Remove the trace. You can also push Delete on the PC keyboard.
Last modified:
|
20-Nov-2012 |
New topic |