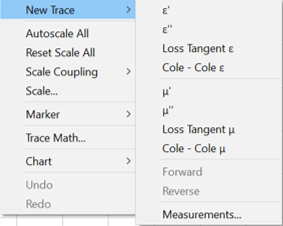
Click Chart to make the following settings:
Format (separate topic)
See Also: Working with Charts and Traces
Also available by right-clicking on the chart.
Permittivity Measurements
εr’ – The real part of the complex permittivity (the dielectric constant) is plotted.
εr” – The imaginary part of the complex permittivity (the loss factor) is plotted.
Loss tangent e – The ratio of the imaginary part (the loss factor) to the real part (the dielectric constant) of the complex permittivity (loss tangent) is plotted.
Cole-Cole e– Loss factor vs. the dielectric constant is plotted.
Permeability Measurements
μr’ – The real part of the complex permeability is plotted.
μr” – The imaginary part of the complex permeability is plotted.
Loss tangent u – The ratio of the imaginary part to the real part of the complex permeability is plotted.
Cole-Cole u– The ratio of the imaginary part to the real part of the complex permeability is plotted.
Also available by right-clicking on the chart.
Select one of the above measurements. The trace will appear in the current (active) chart.
Right-clicking on a plot will also display a menu for adding a new trace.
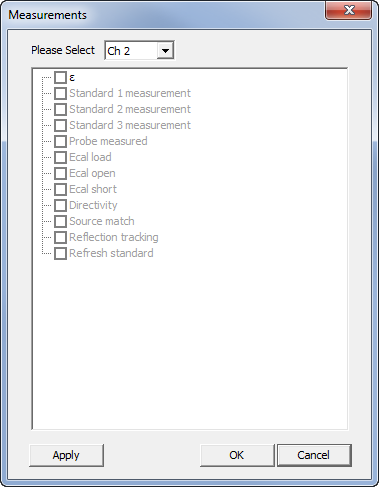
To add a trace in a channel different from currently selected trace, click New Trace->Measurements. The menu shown below will be displayed. Changing a channel can add a different channel’s trace.
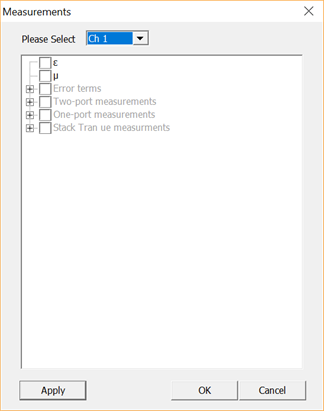
Click Chart, then New Trace, then Measurements to see one of the following dialogs.
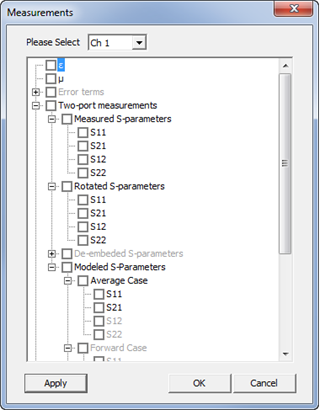
Click + (next to the headings) to show available measurements.
Check boxes to create new traces in the active chart.
Only those measurements with the same number of ports as those in the chart are available.
NOT all parameters are available for all models
Opt.001 Measurements available:
Error terms - view the results from calibration std measurements
Two-port measurements (Opt.001 Only)
Measured S-Parameters - standard Network analyzer measurements. Select a format.
Rotated S-Parameters - VNA rotates phase according to the distance to the sample defined at the sample holder tab.
De-embedded S-Parameters - S-parameters after gap correction.
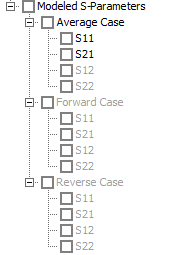
Modeled S-Parameters - Compute equivalent S-Parameters backwards from permittivity result and display it together with S-Parameter measurements. This allows you to compare the differences and provide confidence in the permittivity result.
Opt.002 Measurements available:
Error terms - view the results from calibration std measurements
Probe measured - this is the only S-parameter available. This is a 1-port measurement.
Opt.005/006 Measurements available (varies depending on selected instrument, fixture, and method):
|εr| - Absolute permittivity is plotted.
σ - Conductivity of the material is plotted.
|μr| - Absolute permeability is plotted.
Cp – Equivalent parallel capacitance is plotted.
Cpg – Equivalent parallel capacitance of gap is plotted.
D- Dissipation factor is plotted.
Dg – Dissipation factor of gap is plotted.
G – Equivalent parallel conductance is plotted.
R- Equivalent series resistance is plotted.
X- Equivalent series reactance is plotted.
MUT_R - Calculated series resistance of ideal one-turn coil is plotted.
MUT_X - Calculated series reactance of ideal one-turn coil is plotted
Automatically selects the scale based on the traces displayed.
Autoscale ALL, available by right-clicking on the chart, performs this operation on all displayed traces in the chart.
Also available by right-clicking on the chart.
Off - Scale is set individually for each trace.
Chart - Scale is set for all traces in the chart.
All - Scale is set for all charts.
Also available by right-clicking on the chart.
Starts the following dialog which allows the horizontal and vertical scales to be set for the active trace, chart, or all charts, depending on the Scale Coupling setting.
Note: To quickly zoom on an area of a trace, click and drag the mouse around the specific area.
X max and X min - Enter the minimum and maximum X-axis value and unit. These settings default to the current X-axis range of the calibration and measurement. Reduce these values to zoom in on a measurement.
Reset - Click to reset to the default X-axis settings.
Autoscale - Click to autoscale the chart X-axis and Y-axis.
Graph Mode - Select Linear or Logarithm.
Y max and Y min - Enter the minimum and maximum Y-axis value. Reduce these values to zoom in on a measurement.
Reset - Click to reset to the default Y-axis settings.
Autoscale - Click to autoscale the chart X-axis and Y-axis.
Graph Mode - Select Linear or Logarithm.
Resets the scale to the default values.
Also available by right-clicking on the chart, then pointing to Chart.
A new chart appears with no measurement. Right-click in the chart, then select one of the above measurements.
Also available by right-clicking on the chart, then pointing to Chart.
The chart can also be deleted by pressing Delete on your keyboard.
Available ONLY by right-clicking on the chart, then pointing to Chart.
A duplicate chart is created identical to the one just right-clicked.
Enter a title for your measurement by clicking Chart then Title. 'Title' is shown by default.
Enter a subtitle for your measurement. 'SubTitle' is shown by default.
Last modified:
18-Mar-2021 |
Deleted "Fitted S-parameters" bullet information |
28-Sept-2020 |
Added New Trace menu by right-clicking on a plot |
26-Jan-2016 |
Added modeled S-parameters feature |
14-July-2014 |
Updated for converged SW |
4-Nov-2013 |
Added Title and Subtitle from Preferences |
1-Jul-2013 |
Added copy chart |
20-Nov-2012 |
Major edits |