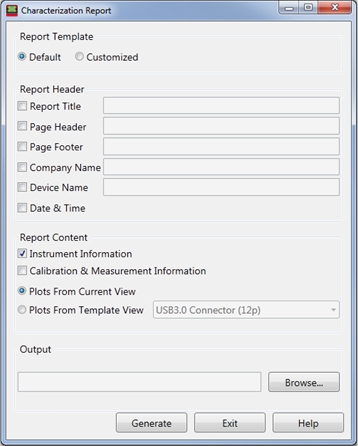
The Characterization Report is a standard report that can be generated to show:
Instrument Configuration
Calibration and Measurement Information
Plots that are in the current view or plots that are in a Template.
Output in *.html, *.pdf, or Word (*.doc) formats.
Beginning with PLTS 2016, reports can be customized to meet your specific needs. Refer to Customizing a Characterization Report for more information.
To generate the characterization report:
Click File, then Characterization Report.

Check the Report Header items to include in the report and enter the appropriate information.
Check the Report Content items to include in the report.
Select the Plots to include in the report:
From Current View - Plots in the active window.
From View Template - Plots in the active Template.
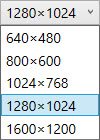
Select the Plot Size
from the pull-down menu:

Select a File Type:
*.html - Opens in web browser
*.pdf - Opens in Adobe Acrobat
*.doc - Opens in Microsoft Word.
Browse to a location to save the report and enter a filename.
Click Generate to create the report.
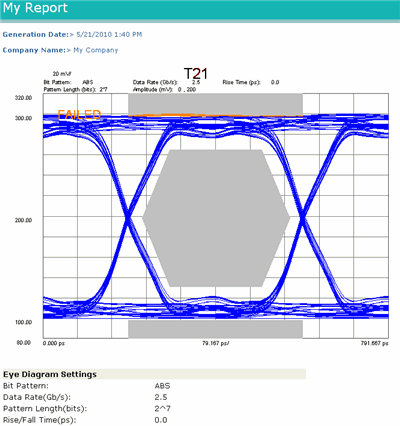
The following is an example report created with the settings in the above dialog.
