Beginning with PLTS 2016, all of the formatting tools available within MSWord® can be used to create customized reports. You can start from an existing MSWord document and edit it or start from a new one. Once the content is added and formatted, MSWord content controls and PLTS tags are inserted into the MSWord file that map the PLTS data to the report template. The report is then generated from the PLTS screen.
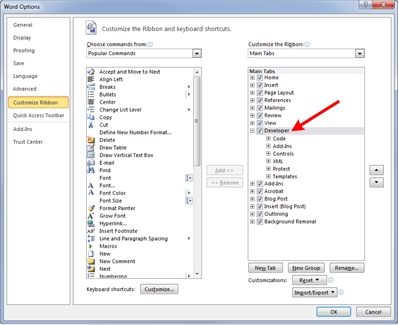
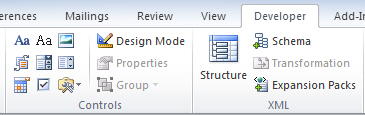
The Developer Tab Controls group is used to insert various content controls and PLTS tags. This tab is not visible by default. The following procedure shows how to show the Developer Tab in MSWord.
Start MSWord.
Click on File tab then Options.
Select Customize Ribbon then check Developer.
The following procedures show how to start from an existing template or create a new one from a blank document. You can also start from any MSWord document, add new content and content control tags, then save it as a Word document file. This is a convenient way to embed measurement data into any existing document.
Click on the File tab.
If you want to start from an existing template or create a new one from a blank document, perform the following:
Click New.
From the Available Templates, select an existing template or click on Blank document to create a new one.
If you want to start from an existing MSWord file, perform the following:
Click Open.
Navigate to the location of the file.
Click on the Open button.
Click on the File tab again.
Click Save As and navigate to a location to save the file.
Type a name for the file.
In the Save as type drop down menu, select Word Document to save the file as a document.
Plain text content controls are used to insert data anywhere within an MSWord file and can then be formatted using the tools in MSWord.
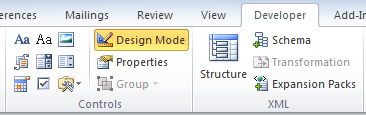
Ensure that the content control fields are visible in MSWord as described in Showing the Developer Tab.
Position the cursor where you want to insert the plain text content control. This can be anywhere within a paragraph, table cell, etc.
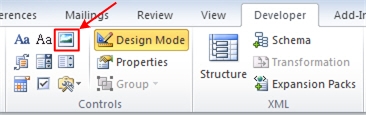
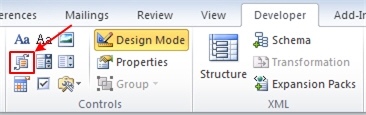
In the Developer tab, click on the Plain Text Content Control icon.

Ensure that a place holder has been inserted into the MSWord file.

In the Developer tab, click on the Properties icon to open the Content Control Properties dialog.

In the Title field, add a title. The title does not appear in the final output file. The intent is to help identify the data if necessary.
In the Tag field, add a plain text PLTS tag. Refer to the list shown in List of PLTS Tags.
Click on the OK button. Note that the plain text content control tag name entered in the Tag field is now displayed. In the following example, Version Number was entered as the title and PLTSVersion as the tag.
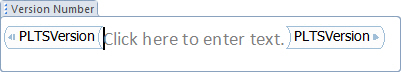
Highlight "Click here to enter text" and enter text to help identify the data. For example, type PLTS Version. This is helpful when viewing the MSWord file with Design Mode disabled because this text is all that will be visible.
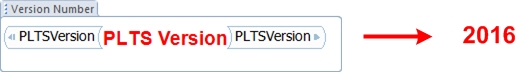
Highlight the text again and use MSWord's formatting tools to change the formatting. Whatever formatting is applied to this text will be applied to the output as shown in the following example for the PLTSVersion plain text content control tag.
When finished, save the file as a Word Document.
Picture content controls are used to insert plots anywhere within a MSWord file and can then be resized as necessary.
Ensure that the content control fields are visible in MSWord as described in Showing the Developer Tab.
Position the cursor where you want to insert the picture content control.
In the Developer tab, click on the Picture Content Control icon.
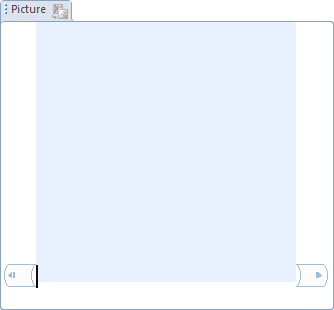
Ensure that a place holder has been inserted into the MSWord file.
In the Developer tab, click on the Properties icon to open the Content Control Properties dialog.

In the Title field, add a title. The title does not appear in the final output file. The intent is to help identify the data if necessary.
In the Tag field, add a picture content control tag. Refer to the list shown in List of Content Control Tags.
Click on the OK button. Note that the tag name entered in the Tag field is now displayed. In the following example, Plot 1 was entered as the title and Plot1as the tag.

To resize the graphic, click the blue shaded box then drag a corner to resize. Pressing and holding the Shift key while resizing maintains the aspect ratio. The following example shows a picture content control place holder being resized and the resulting output for the Plot1 tag.

When finished, save the file as a Word Document.
Building block gallery content controls are used to insert tabular data for the traces within a specified plot into a MSWord file. You must first create a table having two rows and two columns and then "wrap" it in the building block gallery content control.
Ensure that the content control fields are visible in MSWord as described in Showing the Developer Tab.
Create a table with two rows and two columns. When the report is generated, each column will contain the trace data of one trace. If a plot has more than two traces (two columns), PLTS automatically adds columns depending on the number of traces.
Format the table as necessary. Add shading, add or remove horizontal/vertical rules, etc.
Ensure that at least one blank line exists after the table.
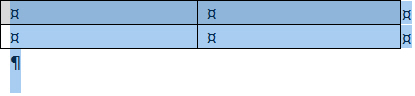
Highlight the entire table plus one blank line after the table as shown.
Ensure that a place holder has been inserted into the MSWord file.
In the Developer tab, click on the Properties icon to open the Content Control Properties dialog.

In the Title field, add a title. The title does not appear in the final output file. The intent is to help identify the data if necessary.
In the Tag field, add the trace data tag. Refer to the list shown in List of Content Control Tags.
Click on the OK button. Note that the tag name entered in the Tag field is now displayed. In the following example, Plot 1 Tabular Data was entered as the title and Plot1TracesDataTable as the tag. The resulting output from the selected plot has two traces (TDD21 and TDD43).

When finished, save the file as a Word Document.
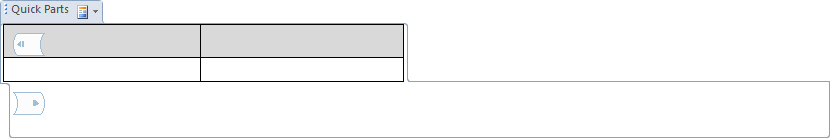
Building block gallery content controls are used to insert marker data within a specified plot into a MSWord file. You must first create a table having at least four rows and ten columns and then "wrap" it in a building block gallery content control. In addition, you must include the XUnit and YUnit tags using the plain text content control.
Ensure that the content control fields are visible in MSWord as described in Showing the Developer Tab.
Create a table with at least four rows and ten columns. When the report is generated, each column will contain the marker data of each trace using this marker. If a plot has less than nine markers, PLTS automatically removes columns depending on the number of markers. Similarly, if a plot only has one trace, PLTS automatically removes the extra row. If a plot has more than two traces, extra rows will be added automatically.
Format the table as necessary. Add shading, add or remove horizontal/vertical rules, etc.
Ensure that at least one blank line exists after the table.
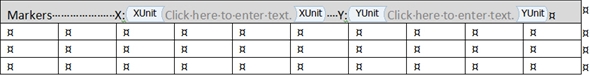
Add the XUnit and YUnit tags to the table using the plain text content control. This adds the unit of measure for each axis. The X axis is in ns and the Y axis is in V. The following shows them added in the first row of the table along with the word "Markers".
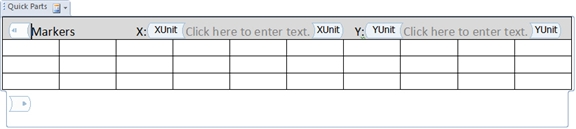
Highlight the entire table plus one blank line after the table as shown.
![]()
Ensure that a place holder has been inserted into the MSWord file.
In the Developer tab, click on the Properties icon to open the Content Control Properties dialog.
In the Title field, add a title. The title does not appear in the final output file. The intent is to help identify the data if necessary.
In the Tag field, add the marker data tag. Refer to the list shown in List of Content Control Tags.
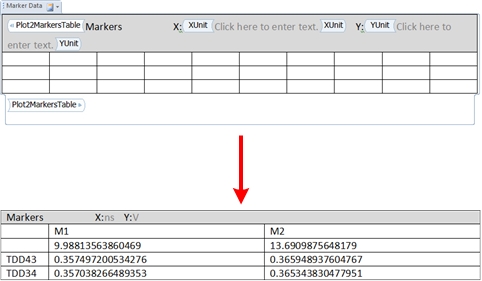
Click on the OK button. Note that the tag name entered in the Tag field is now displayed. In the following example, Marker Data was entered as the title and Plot2MarkersTable as the tag. The resulting output from the selected plot has two markers per trace and there are two traces. The first row of data is the X axis value in ns.
When finished, save the file as a Word Document.
Customized reports can be generated as a MSWord document, PDF, or HTML file. The MSWord file used as the customized template for the report must be a MSWord document (not a MSWord template).
In the PLTS screen, select File then Characterization Report.
In the Characterization
Report dialog under Report
Template, select Customized.

Under Report Template, click Browse to select the template (MSWord document) to use for the customized report.
Under Report Content, select Plots From Current View or Plots From Template View. Learn more.
Select the Plot Size
from the pull-down menu:
Under Output, click Browse to select the location, filename, and file type for the report file.
Click the Generate button.
PLTS Tag Name |
Output Example |
Description |
User Input Information |
||
Title |
Characterization Report | Report title |
Header1 |
XYZ Company ABC Product Prototype Test |
Header text |
Footer1 |
XYZ Company Confidential |
Footer text |
CompanyName |
XYZ Company | Company name |
DutName |
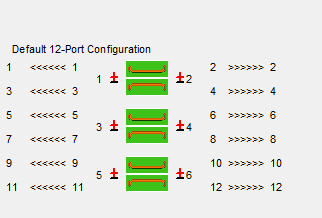
12-Port Configuration | DUT name |
GenerationDateTime |
12/11/2015 08:55:56 |
Time of report generation |
PLTS Information |
||
PLTSVersion |
2016 |
Version number |
VNA Calibration and Measurement Settings |
||
InstrumentIDN |
Keysight Technologies,Virtual N5242A,000001,000001 |
Instrument identification |
CalibrationType |
SOLT |
Calibration type |
CalibrationTime |
October 01 2015 15:35:00 |
Time of last calibration |
FDMeasurementStartFrequency |
10MHz |
Frequency domain start frequency |
FDMeasurementStepFrequency |
10MHz |
Frequency domain step frequency |
FDMeasurementStopFrequency |
20000MHz |
Frequency domain stop frequency |
FDMeasurementIFBW |
0KHz |
Frequency domain IF bandwidth |
MeasurementStimulusPower |
0dBm |
Stimulus power in dBm |
MeasurementAveragingCount |
1 |
Measurement averaging count |
MeasurementNumberOfPoints |
2000 |
Number of measurement points |
DutConfiguration |
Entered as a Plain Text Content Control: 1|1|<<<<<<|2|2|>>>>>>|3|3|<<<<<<|4|4|>>>>>>|5|5|<<<<<<|6|6| >>>>>>|7|7|<<<<<<|8|8|>>>>>>|9|9|<<<<<<|10|10|>>>>>>|11|11|<<<<<<|12|12| >>>>>>| Entered as a Picture Content Control:
|
This PLTS tag can be entered using either a plain text or picture content control. |
MeasurementFileName |
C:\PLTS\Tests\characterization_report\modifiable_report_demo\12ports.dut |
Path and measurement filename |
View |
||
AnalysisViewName |
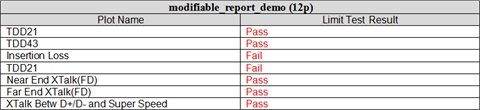
modifiable_report_demo (12p) |
|
Plot |
||
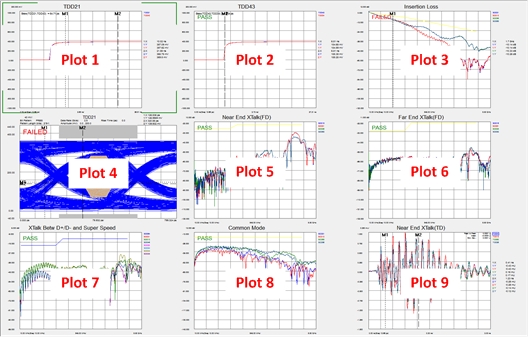
Plot<plotNum>Name |
TDD21 |
|
Plot<plotNum> |
|
|
X-Axis |
||
Plot<pltNum>XAxisStartValue |
0 |
X axis start value of the specified plot |
Plot<pltNum>XAxisStopValue |
27.3136568284142 |
X axis stop value of the specified plot |
Plot<pltNum>XAxisUnit |
ns |
X axis units of the specified plot |
Plot<pltNum>XAxisResolutionValue |
0.0135135101317542 |
X axis resolution value of the specified plot |
Plot<pltNum>NumberOfPoints |
2000 |
Number of measurement points of the specified plot |
Eye Diagram |
||
Plot<pltNum>EyeBitPatternName |
PRBS |
Type of eye test pattern |
Plot<pltNum>EyeBitPatternDataRate |
2.5 |
Data rate of the eye pattern in Gb/s |
Plot<pltNum>EyeBitPatternLength |
2^9-1 |
Length of the PRBS data pattern in bits |
Plot<pltNum>EyeBitPatternRiseTime |
281.6034 |
10% to 90% rise time in ps |
Markers |
||
Plot<plotNum>MarkersTable XUnit YUnit |
|
A Markers Table must have at least four rows and ten columns and the table must be "wrapped" using a Building Block Gallery Content Control. In addition, you must include the XUnit and YUnit plain text content control tags. |
Plot<plotNum>Marker<markerNum>X |
10.3707181254459ns |
This control tag holds the X value of the specified marker in the specified plot. |
Limit Line Test, EYE Mask Test |
||
Plot<plotNum>LimitTestResult |
|
The Plot<plotNum>LimitTestResult tag was used to return the pass/fail results shown in the Limit Test Result column. The Plot<plotNum>Name tag was used to return the names shown in the Plot Name column. The AnalysisViewName was used in the first row of the table. |
Skew Measurement |
||
Plot<plotNum>SkewTrace1 |
TDD43 |
Trace 1 name.
|
Plot<plotNum>SkewTrace2 |
TDD34 |
Trace 2 name.
|
Plot<plotNum>SkewValue |
= 64.7076998596923 ps |
Skew values are relative to the first trace. A negative value indicates that the second trace is longer than the first trace. A positive value indicates that the second trace is shorter than the first trace. |
Plot<plotNum>SkewLimitResult |
Pass |
If the skew value is greater than the Skew limit value entered in the Skew Measurement dialog, then Fail is returned; if the skew value is less than the Skew limit, then Pass is returned. |
Tabular Trace Data |
||
Plot<plotNum>TracesDataTable |
|
Returns the trace data for the specified plot. A Trace Data Table must have at least two rows and two columns and the table must be "wrapped" using a Building Block Gallery Content Control. |