Panel Locations
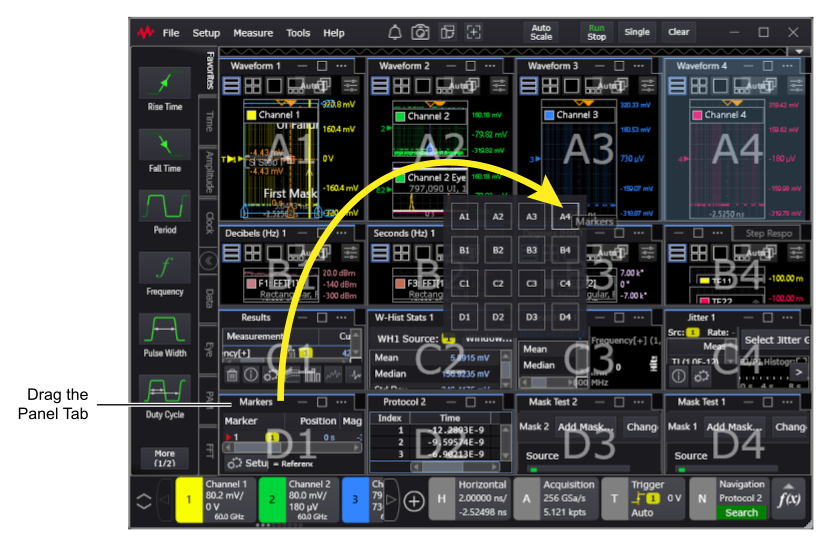
As shown in the following picture, there are 16 panel locations in a four-by-four grid with rows A, B, C, and D and columns 1, 2, 3, and 4. Infiniium uses these panels to show waveforms and scalar measurement results, that is, content windows.
When content windows occupy the same panel grid location, they are tabbed.
You can move content between any of these panels by dragging a panel's tab over a drop target (or a different panel tab). Drop zones are highlighted in blue.
Splitter controls between the panel locations can be dragged to size the columns or rows.
The panel grid system gives you flexibility to organize waveforms, results, graphs, etc., however you like. You can use all panel grid locations or you can place everything in just a few locations.
Default Measurement Results Panel Locations
By default, waveforms are shown in the top panels and measurement results are shown in the bottom panels. The panels and content appear only when needed. For example, if you perform a rise time measurement, the Results content window appears in a bottom panel.
However, this can be affected by the bottom mode versus right mode ( ) selection. See Infiniium Display Overview.