Noise Graphs
With the Jitter analysis software, graphs and histograms are displayed in the Jitter results content window.
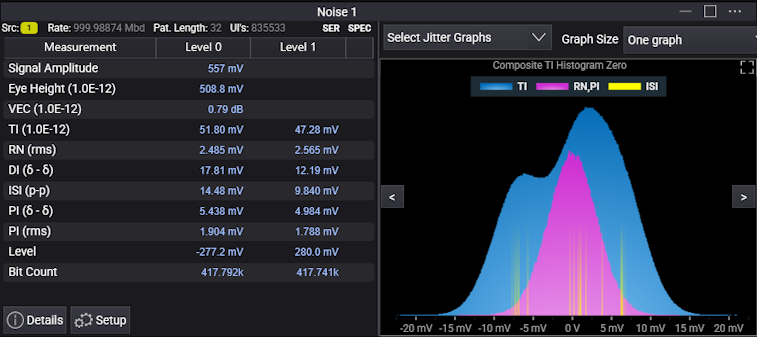
The Select Noise Graphs drop-down list lets you select the graphs you want to display.
The Graph Size drop-down specifies how the selected jitter graphs should be displayed. You can select: Auto fit small size graphs, Auto fit medium size graphs, Auto fit large size graphs, One graph, or in 1x2, 2x1, 2x2, 2x3, 3x2, or 3x3 grids. When there are more graphs than will fit in the available space, arrows at the left and right let you navigate to the previous or next graph(s).
For a description of the measurement results, see Noise Measurement Results.