Viewing Response Correction Graphs
When the RemoveCable or RemoveProbe wizard completes, you can select the Show Graphs option to view the correction and analysis graphs in a content window.
Graphs include:
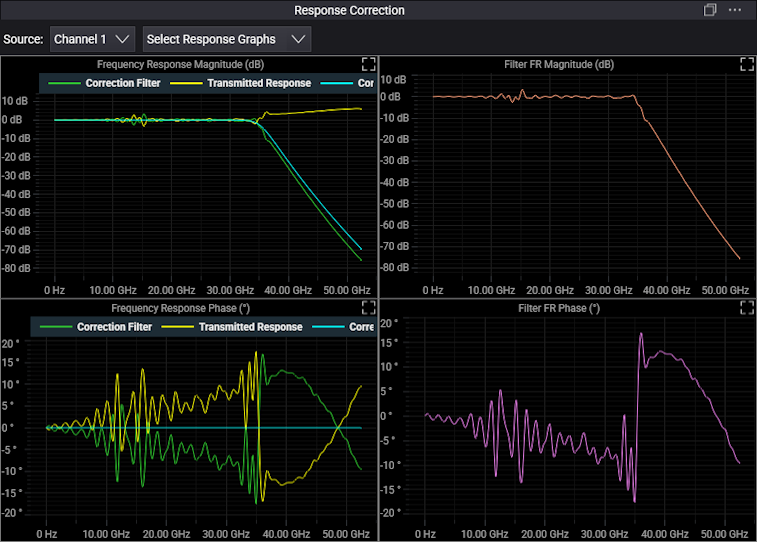
- Frequency Response Magnitude (dB) — This graph shows the probe/cable's frequency response magnitude and the corrected response.
- Frequency Response Phase (°) — This graph shows the probe/cable's frequency response deviation from linear phase and the corrected response.
- Filter FR Magnitude (dB) — This graph shows only the magnitude correction for the probe/cable. This information is also shown in the Frequency Response Magnitude summary graph.
- Filter FR Phase (°) — This graph shows only the phase correction for the probe/cable. This result is also shown in the Frequency Response Phase summary graph.
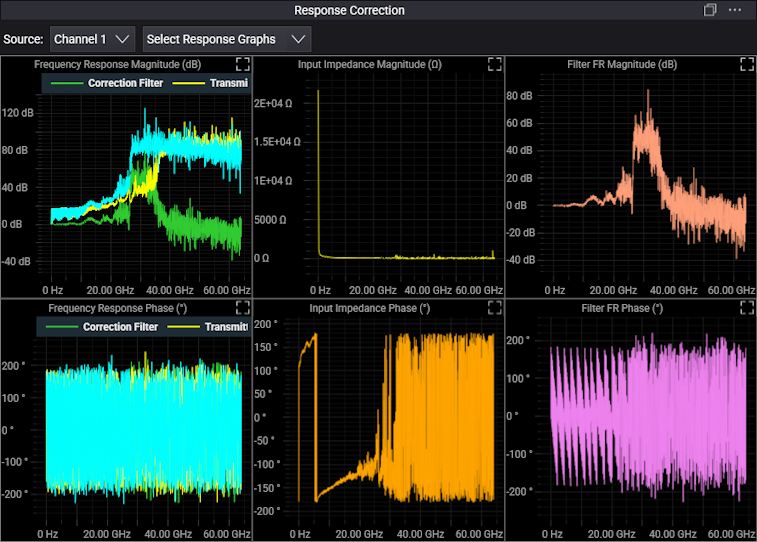
- Input Impedance Magnitude (Ω) — For RemoveProbe only, this graph shows loading of the probing system using an impedance magnitude plot. Markers can be aligned with the plot to show capacitive impedance and inductive impedance of the probing system.
- Input Impedance Phase (°) — For RemoveProbe only, this graph shows loading of the probing system using an impedance phase plot. Markers can be aligned with the plot to show capacitive impedance and inductive impedance of the probing system.
Because boosting signals at higher frequencies also boosts noise, you may want to make adjustments to the RemoveCable/RemoveProbe AC calibrations. See the Corrected Bandwidth description at Deembedding.