Other topics about Data Analysis
Spurious can be defined by either of the following two methods. The threshold is defined by selected method. Then, when the measured value exceed over the threshold, it is defined as a spurious.
Define the threshold in terms of the standard deviation ( σ ) value which is calculated from the measurement result moving average.
Threshold can be set at the standard deviation ( σ ) × sensitivity. Refer to Setting Spurious Sensibility.
Using the csv file which define the threshold. Refer to Confirming Spurious using Threshold table. The threshold csv file should be defined in advance.
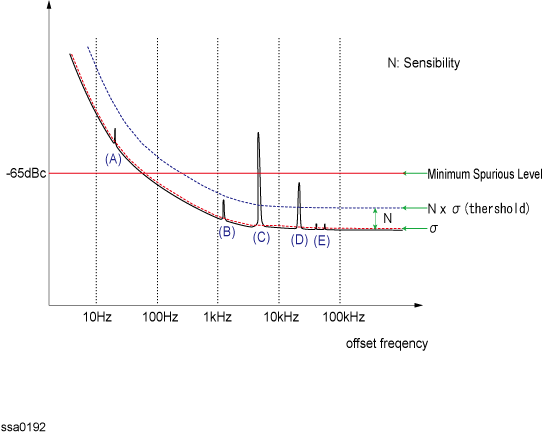
If the spurious data is bigger than this minimum spurious level, it is omitted the spurious data, or displayed it with Power (dBc).
For example, there are two peaks (C) and (D) which are detected as a spurious in the figure below. When it is displayed with Power (dBc), the part of peak (C) which is above the minimum spurious level is colored in white.
This function does not affect data itself even if the peak is detected as a spurious.
Press Trace/View > Spurious > Minimum Spur Level to adjust the minimum spurious level.
Follow the steps below to use the spurious sensibility function.
Press Trace/View > Spurious > Spur Sensibility
Enter the spurious sensibility value in the data entry field that appears in the upper part of the screen.
The low peak has real sensibility when the value is small.
Spurious Judgement using spurious sensibility
The E5052B obtains a reference waveform based on the moving average of the phase noise, AM noise, Baseband and segment phase noise measurement results, and regards any data as spurious that may vary significantly from the reference waveform.
Press Trace/View > Spurious.
Press Import Threshold table... to import the threshold data file that you defined in advance.
Press Power (dBc for Phase Noise/AM noise and dBV for BaseBand). The data regarded as spurious is displayed by highlight. You can view the stimulus and response values for each peak of spurious in a text file by pressing Spurious List.
By Pressing Omit, the data regarded as spurious is replaced by the reference waveform that the E5052B calculated. By pressing Normalized (dBc/Hz for Phase Noise/AM noise and dBV/Hz for BaseBand), the data displayed is back to the measurement data.
Press Trace/View > Spurious > Minimum Spur Level to adjust the minimum spurious level.
If the spurious data is bigger than this minimum spurious level, it is omitted the spurious data, or displayed it with Power (dBc).
By pressing Clear Threshold Table, the threshold table is cleared and set to the initial value, 0, 2, 30. By pressing Explorer, the file explorer is activated to find a file.
Spurious Judgment using threshold table
You can view the measurement points regarded as spurious in power (dBc). You can also provide any user-defined threshold for determining spurious.
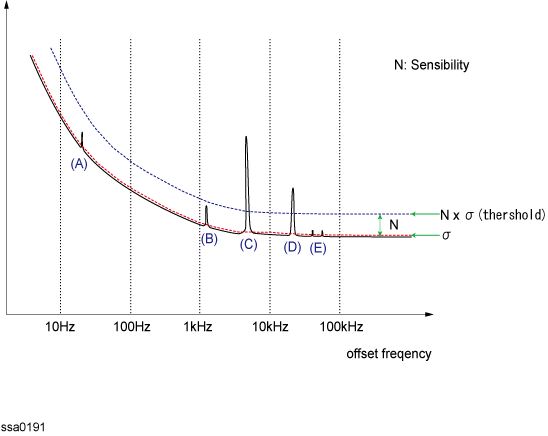
Spurious judgment
|
(A), (E) |
For measurement values falling in the range for which no threshold is specified (A), or between the upper and lower thresholds (E), the E5052B determines whether or not they are spurious based on its own determination criteria. |
|
(B) |
The E5052B considers the spurious smaller than the lower threshold as non-spurious regardless of its own determination criteria. |
|
(C), (D) |
The E5052B considers the spurious greater than the upper threshold as spurious regardless of its own determination criteria. |
To specify the threshold for spurious, you must define the threshold table in advance. Define the threshold data in the following format, and then save it in the CSV format (with the extension of *.csv).
freq_from, threshold_min, threshold_max
freq_from, threshold_min, threshold_max
:
freq_from, threshold_min, threshold_max
|
Parameter |
Overview |
|
freq_from |
Setting the start point of the threshold for spurious. You can not specify the end point. If the next start point and upper/lower threshold values are not specified, this threshold is valid until the stop frequency. |
|
threshold_min |
Lower threshold value |
|
threshold_max |
Upper threshold value |
One line represents one segment, and you can specify up to 50 segments in the threshold table.
If the upper threshold is smaller than the lower threshold, the former will take precedence.
You can comment out the line by placing "#" at the beginning of the line.
Phase Noise is usually presented logarithmically as a plot of phase modulation sidebands in the frequency domain, expressed in dB relative to the carrier power per Hertz of bandwidth [dBc/Hz]. The default setting of the phase noise measurement on the SSA is [dBc/Hz] and the bandwidth is almost 1% of the offset frequency. The spurious is distinguished from noise, and the spurious power level is expressed in dB relative to the carrier power normally.
The difference between the phase noise measurement and a spectrum analyzer in measuring single sided spurious is 6 dB. If single sided spurious is present, its level can be measured on a spectrum analyzer. However, the measured data in phase noise measurement for a single sided spurious is 6dB lower from its true amplitude because the phase noise measurement assumes double sided spurious.
The E5052B employs a phase detector method like other phase noise measurement systems, which measures double side band (DSB) noise and then converts it to single side band (SSB) noise.
This function analyzes the data state to omit specific spurious. Log interpolation is applied to deleted data by using the neighbouring data.
Press Trace/View > Spurious > Omit specified Spur.
Select Omit > On | Off from the softkey menu list.
OmitS is displayed at the bottom of screen.
Select Import Spurious Table... to import the spurious data file.
Select Export Spurious Table... from the softkey menu list.
By pressing Clear Spurious Table, the spurious list is cleared.
It is available to set the value of frequency to be Omit, using marker. For information on Marker to Spurious, refer to Specifying Sweep Range by Using Marker
It is not possible to be likely to omit the spurious only by specifying the frequency at one point. When it is judged the spurious still remains, it is required to expand the specified frequency and target it in omit.
The existing Spurious list data cannot be read directly due to jitter value so it is read corresponding to the X-axis frequency.
The operation for input/output is same as Limit test. Enter the number of spurious input with COUNt, then register the spurious with FLISt. The following commands are used for input/output spurious frequency list:
SCPI.CALCulate.AM(Ch).TRACe(Tr).SPURious.OSSPur.FLISt.CLEar
SCPI.CALCulate.AM(Ch).TRACe(Tr).SPURious.OSSPur.FLISt.COUNt
SCPI.CALCulate.AM(Ch).TRACe(Tr).SPURious.OSSPur.FLISt.DATA
SCPI.CALCulate.BB(Ch).TRACe(Tr).SPURious.OSSPur.FLISt.CLEar
SCPI.CALCulate.BB(Ch).TRACe(Tr).SPURious.OSSPur.FLISt.COUNt
SCPI.CALCulate.BB(Ch).TRACe(Tr).SPURious.OSSPur.FLISt.DATA
SCPI.CALCulate.PN(Ch).TRACe(Tr).SPURious.OSSPur.FLISt.CLEar
SCPI.CALCulate.PN(Ch).TRACe(Tr).SPURious.OSSPur.FLISt.COUNt
SCPI.CALCulate.PN(Ch).TRACe(Tr).SPURious.OSSPur.FLISt.DATA
SCPI.CALCulate.PS(Ch).TRACe(Tr).SPURious.OSSPur.FLISt.CLEar
SCPI.CALCulate.PS(Ch).TRACe(Tr).SPURious.OSSPur.FLISt.COUNt
SCPI.CALCulate.PS(Ch).TRACe(Tr).SPURious.OSSPur.FLISt.DATA
The following command enables to read the matrix data array with csv:
SCPI.MMEMory.AM(Ch).TRACe(Tr).LOAD.SPURious.OSSPur.FLISt
SCPI.MMEMory.AM(Ch).TRACe(Tr).STORe.SPURious.OSSPur.FLISt
SCPI.MMEMory.BB(Ch).TRACe(Tr).LOAD.SPURious.OSSPur.FLISt
SCPI.MMEMory.BB(Ch).TRACe(Tr).STORe.SPURious.OSSPur.FLISt
SCPI.MMEMory.PN(Ch).TRACe(Tr).LOAD.SPURious.OSSPur.FLISt
SCPI.MMEMory.PN(Ch).TRACe(Tr).STORe.SPURious.OSSPur.FLISt