Follow the steps below to confirm the results of the DUT’s frequency transient (Narrow Band) measurement by using the E5052B’s transient measurement window.
You can use the Narrow2 Band when Narrow-Narrow measurement mode is selected.
Press the Trace/Next key to select the measurement trace for the frequency transient (Narrow Band). You can confirm which trace is selected by viewing the cursor which is displayed in the left to the trace title.
You can also click on the measurement trace of the frequency transient (Narrow Band) for confirmation.
You can select the unit (frequency format) used in the frequency trace screen and set the sensitivity aperture.
Press Format > Frequency Format.
Select an appropriate frequency format from the softkey menu list. The available options are as follows. The initial setting is "Hz".
Format List
|
Softkey |
Overview |
|
Hz |
Displays the measurement frequency data. |
|
ΔHz |
Displays the difference subtracted from reference frequency. |
|
% |
Displays the difference subtracted from reference frequency in percent. |
|
ppm |
Displays the difference subtracted from reference frequency in ppm. |
Press Format > Frequency Reference. (This setting will be used when either "ΔHz", "%", "ppm" is selected for the frequency format.)
Enter the frequency reference value in the data entry field that appears in the upper part of the screen. The unit is Hz.
Press Marker to display marker 1 on the screen.
Move marker 1 to the point you want to confirm and read the measurement value displayed in the upper part of the graph. To confirm multiple values, press Marker > Marker x (x=1 to 10), which allows you to display up to marker 10.
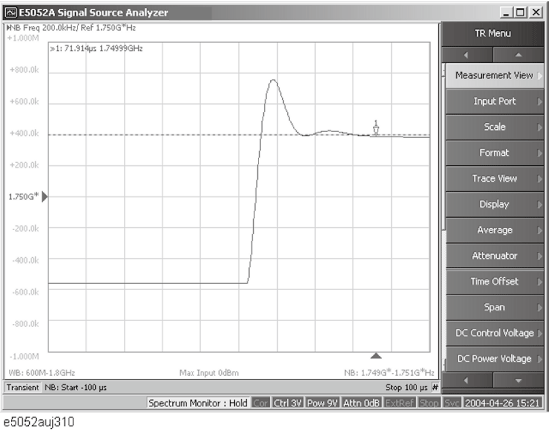
Example of Measurement Screen (frequency transient narrow band)