In this topic:
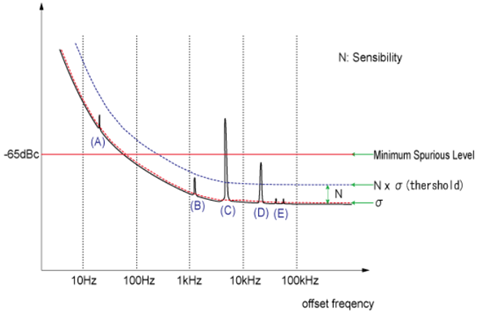
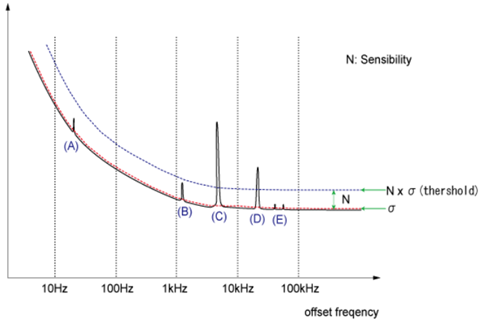
The criteria used for a spurious measurement defines the threshold in terms of the standard deviation ( σ ) value which is calculated from the measurement result moving average.
The threshold can be set as the standard deviation ( σ ) × sensibility. When the measured value exceeds the threshold, it is defined as a spur.
When the Phase Noise Measurement Class is selected and a Phase Noise channel is created, the default measurement parameter is PN.
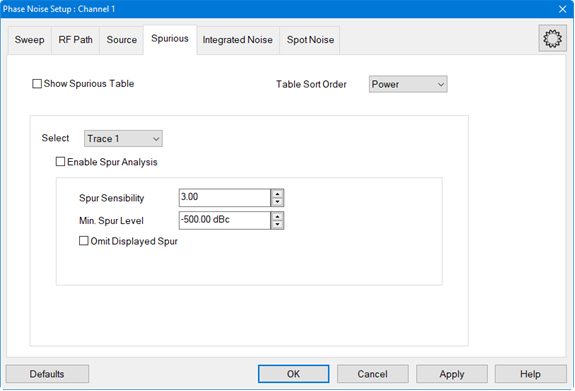
In the Spurious tab, click on the Select drop down menu and select New Traces....
In the New Trace dialog, select PN.
If the spurious data is exceeds the minimum spurious level, it is omitted from the spurious data, or it is displayed as Power (dBc).
For example, there are two peaks (C) and (D) which are detected as a spurious in the figure below. When Power (dBc) is displayed, the peak (C) which is above the minimum spurious level turns white in color.
In the Spurious tab, click on the Select drop down menu and select the desired trace.
Set the Min. Spur Level by either using the up/down arrows or by double-clicking in the data entry field and entering the level using the displayed keypad.
The following procedure describes how to set spurious sensibility.
In the Spurious tab, click on the Select drop down menu and select the desired trace.
Set the Spur Sensibility by either using the up/down arrows or by double-clicking in the data entry field and entering the value using the displayed keypad.
This function will omit all displayed spurs.
In the Spurious tab, click on the Select drop down menu and select the desired trace.
Check Omit Displayed
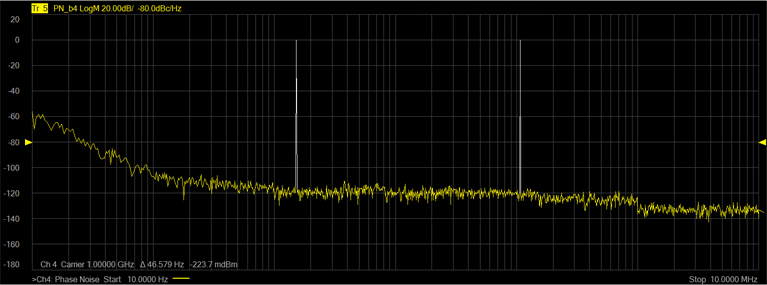
Spur. The following shows two spurs displayed in the top trace
and, after checking Omit Displayed
Spur, the bottom trace shows that the spurs are omitted.

An interference between the DUT carrier frequency and the analyzer system clock frequency may cause a systematic spur. This spur is predictable and automatically is canceled in the phase measurement class by default.
All spurs are calculated for the RAW data. Then, determine which one is derived from a DUT carrier.
"System Spur omission" and "Omit Displayed Spur" are no dependency on each other. They are worked independently.
As this function cancels not only the points from predicted calculation but also adjacent points, the original spur of DUT may be canceled if they are overlapped.
The system spur omission can be turned off by the :SENSe:PN:SPURious:SYSTem:OMISsion[:STATe].
Note: Due to the constraints of the Decomposition Model calculations, when the Offset is set to Stop 100 MHz, the spur at the 100 MHz position will be omitted. To display this spur, set the Stop Offset to a value greater than 100 MHz, or set the Decomposition Model (:SENS:PN:COMP:MOD) to 0 or 1.
The Spurious Table can be displayed below the trace area of the display showing Trace and Spur number, Offset frequency, Power level, and Jitter.
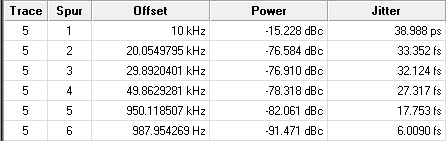
In the Spurious tab, check Show Spurious Table.
To sort the table, click on the Table Sort Order drop down menu and select Power to sort by power or Offset to sort by offset frequency.
This function enables spurious analysis search markers. See Spurious Search.
In the Spurious tab, click on the Select drop down menu and select the desired trace.
Check Enable Spur Analysis then click OK to exit the dialog.
On the analyzer front panel, press Search
> Spurious > Spurious
Search. A marker is displayed over the first spur:
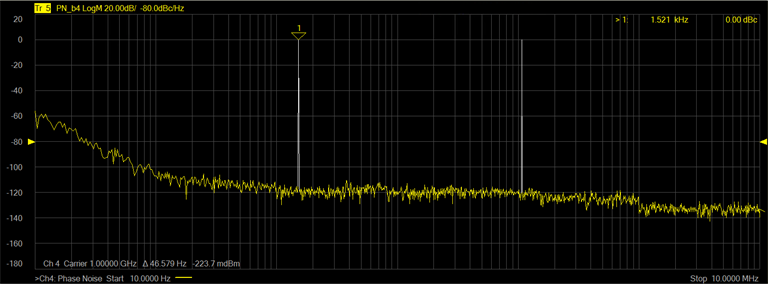
Note the frequency and level from the carrier are displayed in the top-right corner of the display.
To move the marker to the next spur on the right, press Spurious Right >> Search.
To move the marker to a spur on the left, press Spurious Left >> Search.
To place markers on all displayed spurs, press Multi Spurious Search.
To turn off all markers, press Marker > Marker Setup > All Off.