Performing Eye Diagram Measurements

Other topics about Eye Diagram and Mask Test

Overview

In the oscilloscope, an eye diagram is often used to analyze signal quality. You can diagnose problems, such as attenuation, noise, jitter, and dispersion that arise or characterize specific parts of the system with one display.

The E5071C option TDR provides simulated eye diagram analysis capability, eliminating the need for a hardware pulse pattern generator. The virtual bit pattern generator is used to define a virtual bit pattern. The defined bit pattern is then convolved with the device impulse response to create an extremely accurate measurement based eye diagram.

Showing Eye Diagram

  1. Select the trace number which you want to observe the eye diagram.

  2. Click Draw Eye to display the eye diagram.

  3. Whenever you change the setting of data pattern, it is required to click Draw Eye to reflect the setting on the waveform.

Displaying Results

  1. Select Rise Time Def under Results.

  2. Click Draw Eye to display the result.
    Whenever you change the setting of Rise Time Def, it is required to click Draw Eye  to reflect on the result.

The following results are displayed on the table under Results.

Name

Unit

Description

Rise Time

Second

Rise Time Def=10%-90%: Time at 90% level - Time at 10% level

Rise Time Def=20%-80%: Time at 80% level - Time at 20% level

Fall Time

Second

Rise Time Def=10%-90%: Time at 90% level - Time at 10% level

Rise Time Def=20%-80%: Time at 80% level - Time at 20% level

Jitter RMS

Second

1σ width of the histogram at the eye crossing point

Jitter p-p

Second

Full width of histogram at the eye crossing point

Crossing Percentage

%

Crossing Height / Amplitude × 100

Opening Factor

None

(Level One -  σ one) - (Level Zero +  σ zero)  / Amplitude

Signal/Noise Ratio

None

(Level One - Level Zero)/( σ one+  σ zero)

Duty Cycle Distortion

Second

|T rise middle - T fall middle|

Duty Cycle Distortion (%)

%

Duty Cycle Distortion (s)/ Bit period × 100
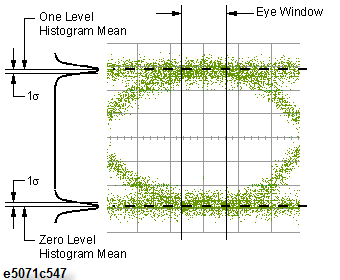
Level Zero

Voltage

Histogram mean for level zero

Level One

Voltage

Histogram mean for level one

Level Mean

Voltage

(Level Zero + Level One) / 2
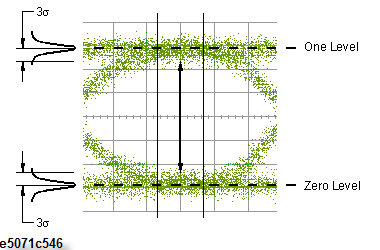
Amplitude

Voltage

Level One - Level Zero

Height

Voltage

(Level One - 3 σ one) - (Level Zero + 3 σ zero)

Width

Second

Bit Period  - 2 × 3 × Jitter RMS

  • Bit Period = 1/Bit Rate

  • Input Amplitude = Setting of Level One - Setting of Level Zero

  • T rise middle  = The time at which the rising edge cross the middle threshold (50%)

  • T fall middle  = The time at which the falling edge cross the middle threshold (50%)

Overlaying the results on the waveform

  1. Select the Overlay check box under Result.

  2. The following results are displayed on the screen.

Saving Results into File

You can save the results as text file.

  1. Click Export to Csv, the Save Eye Result dialog box is displayed.

  2. Type your desired file name, then click Save.

Example of Result

# E5071C ENA Option TDR Simulated Eye Results

# 7/1/2010 3:10:06 PM

#

Level Zero, 0.00337131636124

Level One, 0.392246236818

Level Mean, 0.19780877659

Amplitude, 0.388874920457

Height, 0.372870737968

Width, 9.94598885146E-10

Opening Factor, 0.986281636548

Signal / Noise, 72.894992429

Duty Cycle Distortion, 6.12868274149E-14

Duty Cycle Distortion (%), 0.00612868274149

Rise Time, 4.69421997336E-11

Fall Time, 4.69412762334E-11

Jitter (PP), 6.25E-12

Jitter (RMS), 9.00185809062E-13

Cross Point (%), 49.9268781576


Scaling The Eye Diagram

By default, the eye diagram is set to Auto Scale. You can also set the scale manually.

  1. Click on Scale/Mask.

  2. Select the Manual radio button. This will activate the Scale / Div and Offset options.

  3. Click the entry box Scale / Div and input the Y axis scale value.

  4. Click the entry box for Offset and input the Y axis offset value.

Mask Pattern

See Using Mask Test for more information.

Injecting Jitter

See Using Jitter Injection for more information.