|
Normalize, available only from the Memory menu, (not on the Math / Memory dialog), performs the same function as Data=>Memory, then Data / Memory.
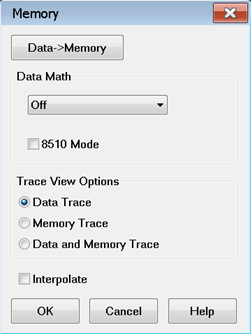
Data=>Memory Puts the active data trace into memory. You can store one memory trace for every displayed trace.
Note: Many VNA features are NOT allowed on Memory traces. For example, Memory traces can NOT be saved to any file type (PRN, SNP, CTI, CSV, MDF). However, you can restore a memory trace to a data trace using the Memory-to-Data utility at the http://na.support.keysight.com/pna/apps/applications.htm website.
Data Math
All math operations are performed on linear (real and imaginary) data before being formatted. See the VNA Data flow.
Data (or OFF) Does no mathematical operation.
Data / Memory - Current measurement data is divided by the data in memory. Use for ratio comparison of two traces, such as measurements of gain or attenuation. Learn more.
Data – Memory - Data in memory is subtracted from the current measurement data. For example, you can use this feature for storing a measured vector error, then subtracting this error from the DUT measurement. Learn more.
Data + Memory - Current measurement data is added to the data in memory. Learn more.
Data * Memory - Current measurement data is multiplied by the data in memory. Learn more.
Trace View Options
Data Trace Displays ONLY the Data trace (with selected math operation applied).
Memory Trace Displays ONLY the trace that was put in memory.
Data and Memory Trace Displays BOTH the Data trace (with selected math operation applied), and the trace that was put in memory.
Interpolate
Note: The E5080A and M9485A do not support this function.
After performing a Data->Memory operation, memory interpolation controls whether the memory data is interpolated or not if the start frequency, stop frequency, or Number of Points is subsequently changed. Using the GUI control, interpolate applies to the currently active measurement. When using the remote interfaces (SCPI or COM), the commands apply to the specified measurement.
Note: Interpolate does not support the 8510 Mode.
The PNA will return to a default interpolation state after a Preset, creating a new trace, or closing the PNA application. The default interpolation state is set in the Preferences dialog by checking or unchecking the Memory: Interpolate ON is the default condition preference. The factory default is unchecked. The default can also be set using the remote interfaces (SCPI or COM).
 When unchecked, after a Data->Memory operation the memory trace's x-y positions will not change if the start or stop frequency is subsequently changed. In addition, if the Number of Points in the sweep is changed after a Data->Memory operation, the memory trace will be invalidated and disappear. If the Number of Points is changed while using Data Math, the Memory trace will be invalidated and Data Math will be forced to the "Off" condition. When unchecked, after a Data->Memory operation the memory trace's x-y positions will not change if the start or stop frequency is subsequently changed. In addition, if the Number of Points in the sweep is changed after a Data->Memory operation, the memory trace will be invalidated and disappear. If the Number of Points is changed while using Data Math, the Memory trace will be invalidated and Data Math will be forced to the "Off" condition.
 When checked, after a Data->Memory operation the memory trace's x-y positions will be interpolated if the start or stop frequency is subsequently changed. In addition, if the Number of Points in the sweep is changed after a Data->Memory operation, the memory trace will be interpolated. When checked, after a Data->Memory operation the memory trace's x-y positions will be interpolated if the start or stop frequency is subsequently changed. In addition, if the Number of Points in the sweep is changed after a Data->Memory operation, the memory trace will be interpolated.
Note: The PNA will not extrapolate to stimulus values beyond the range that was present at the time of the Data->Memory operation. Instead, the Memory data will be invalidated if the stimulus values exceed the original range.
Note: If Interpolate is checked (ON) and stimulus conditions are different than they were at the time of Data->Memory operation, unchecking (OFF) Interpolate will cause the Memory trace to be either updated (using both original and current stimulus settings) or invalidated (if Number of Points changed since Data->Memory operation). The Memory trace will remain disabled until either Interpolate is checked (ON) or the stimulus settings corresponding to the Data->Memory operation are restored.
Learn more about Trace Math (scroll up)
|