Connecting to the 89600 VSA software allows for greater signal evaluation and troubleshooting. Perform dynamic compression with modulated signals, characterize linearization techniques of modulated signals on amplifiers, and verify modulated performance.
In this topic:
Vector Signal Analyzer Option 095
89601B license (200/300)
2-Port or 4-Port PNA/PNA-X with option 22x or 42x
Windows 7 or Windows 10 operating system
System CPU version 7.0 or later
PNA/PNA-X channels must have the same hardware configuration
PNA/PNA-X and VSA must be in single mode when querying results using SCPI commands
VSA GUI may not be refreshed for each sweep
When VSA sample number is greater than the maximum ADC record size, the ADC sample data number is set to the maximum ADC record size, the VSA stops refreshing, and no results will be displayed
Multi-channel measurements are not supported for all demodulation measurements such as TDSCDMA and WCDMA
VSA software runs on the PNA/PNA-X and not on an external PC
One reference receiver per PNA/VSA channel
Broadband mm systems are not supported
PNA-L is not supported
The following installation procedure is only required when performing field upgrades.
Connect an external modulation source to the PNA/PNA-X.
Create a VSA channel and set parameters.
Select the measurement parameters.
Configure the external modulation source to control frequency and power.
Set up the path to the Port 1 output.
Calibrate the VSA channel.
Connect VSA and measure.
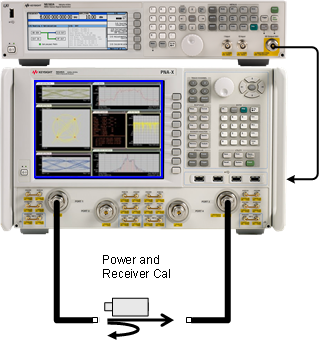
The following configurations show the PNA/PNA-X with Option 219 installed.
Connect the external source through a coupler to the port 1 path as shown above.
Connect the PNA/PNA-X to the external source by HP-IB or LAN.
On the front panel of the PNA/PNA-X, remove the SOURCE OUT to RCVR R1 IN jumper and the CPLR ARM to RCVR A IN jumper.
Connect the external source through a coupler to the port 1 path as shown above.
Make the direct receiver connections to receiver R1 and receiver A through couplers as shown above.
Connect the PNA/PNA-X to the external source by HP-IB or LAN.
The following configuration shows a PNA-X with Option 224 installed.
Connect the external source to J10 on the PNA/PNA-X rear panel.
Connect the PNA/PNA-X to the external source by HP-IB or LAN.
Press Meas > S-Param > Meas Class....
Select VSA, then either:
OK delete the existing measurement, or
New Channel to create the measurement in a new channel.
A Vector Signal Analysis measurement is displayed.
Configure VSA settings |
|
Using Hardkey/SoftTab/Softkey |
Using a mouse |
|
|
|
|
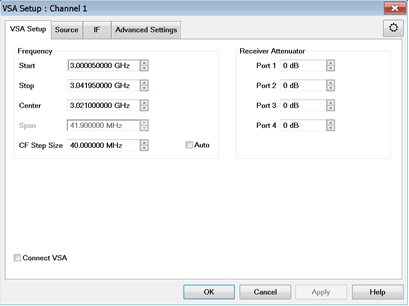
Frequency (See Example configurations) Sets the SA (receiver) frequency range. Use either of the following pairs of settings to determine the frequency range. Start /Stop - Specifies the beginning and end frequency of the swept receiver range. Start is the beginning of the X-axis and Stop is the end of the X-axis. When the Start and Stop frequencies are entered, then the X-axis annotation on the screen shows the Start and Stop frequencies. Center /Span - Specifies the value at the center and frequency range. The Center frequency is at the exact center of the X-axis. The Frequency Span places half of the frequency range on either side of center. When the Center and Frequency Span values are entered, then the X-axis annotation on the screen shows the Center and Span frequencies. CF Step Size - Manually sets the amount Center frequency change that occurs when ▲|▼ is clicked (next to the value). Auto - Each press of the ▲|▼ arrows increments or decrements the Center frequency by 5% of the current frequency span. Receiver AttenuatorReceiver Attenuation is used to protect the test port receivers from damage or compression. Receiver attenuation causes the reported power at the receiver to be less than the power at the test port by the specified amount of attenuation. Receiver Attenuators are offered as an option. Learn more. Type or select independent attenuation values for each test port receiver. A preference can be set to mathematically offset (or NOT) the reported power at the test port receivers by the amount of receiver attenuation. By default, All PNA/PNA-X models offset the display. Learn how to set the preference. Connect VSACheck to launch the VSA software for further signal evaluation.
|
|
|
|
Power On (All Channels) Check to enable source power for all channels. Only turns power ON if the port State setting is ON. Source Cells Name - Lists the test ports through which an internal source is available. If an external source has been configured, it will appear at the bottom of the list. State
Type (Sweep) CW - The source is set to a CW frequency. Linear - The source is set to sweep from the Start to Stop frequency. Frequency - Click in the cell, then click Edit, to start the Frequency Settings dialog (below). Power - Sets the power level at the output of the source. Modulation - Choose from OFF, ON, Pulse. ButtonsPath Configuration
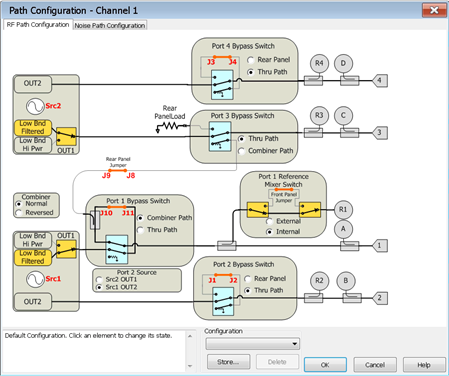
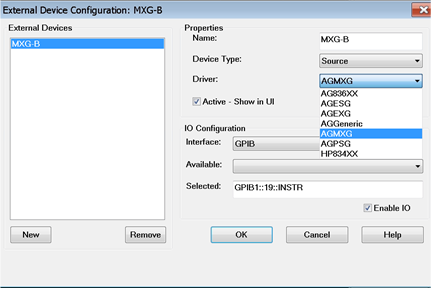
The configuration above shows a 4-port PNA-X with option 423 installed (combiner and mechanical switches). If configuring an external modulation source, select the Combiner Path in the Port 1 Bypass Switch. Learn more Pulse Setup Learn more External Devices
For more information about configuring an external device, see Configure an External Device. Power and Attenuator Learn more |
|
|
|
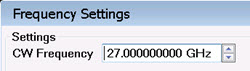
In the Source Setup Tab (above): > When (Sweep) Type = CW, set the CW Frequency.
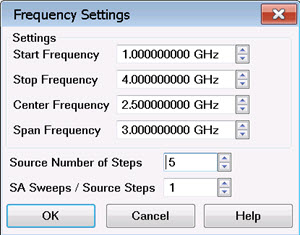
> When (Sweep) Type = Linear, the following dialog appears:
SettingsSets the source frequency range. Use either of the following pairs of settings to set the frequency range. Start /Stop - Specifies the beginning and end frequency of the swept range. Center /Span - Specifies the value at the center and frequency range. Source Number of Steps - Sets the number of steps the source will make across the specified source frequency range. SA Sweeps / Source Step - Sets the number of SA (receiver) sweeps for each Source Step. This setting is common to all sources.
|
|
How to select and configure Measurement Parameters |
|
Using Hardkey/SoftTab/Softkey |
Using a mouse |
|
|
|
|
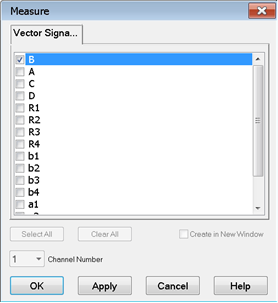
Select one of the test port receivers to make a measurement. Test ports are identified in both traditional PNA/PNA-X notation and Receiver Notation. Learn more. Create in New Window - When checked, the selected measurements are created in a new window. |
|
A calibration is performed on the VSA Channel using Cal All Wizard.
The Cal Plane Manager can be used to characterize adapters, cables, and fixtures used to connect a DUT to the PNA/PNA-X to remove their effects from the measurement. See the detailed procedure.
Connect to VSA |
||
Using the VSA Toolbar |
Using Hardkey/SoftTab/Softkey |
Using a mouse |
 |
|
|
|
|
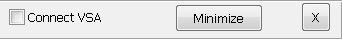
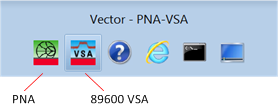
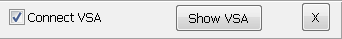
The VSA toolbar is located in the upper-left part of the PNA/PNA-X interface. Connect VSA - Launches the 89600 VSA interface. The PNA/PNA-X channel must be running the VSA application to connect to the 89600 VSA interface. Minimize - Minimizes the PNA/PNA-X interface. Show VSA - Displays the 89600 VSA interface and minimizes the PNA/PNA-X interface. X - Closes the VSA toolbar. To open the toolbar again, select Response, Display, Toolbars, then VSA.
|
|
|
|
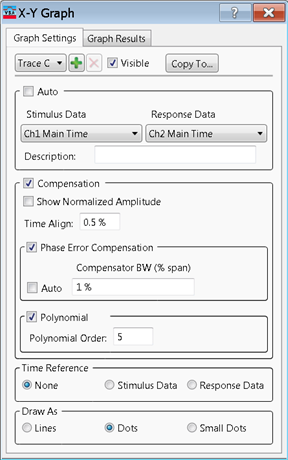
There are several graphs that can be selected in the 89600 VSA for each trace window. Configure the graphs using the X-Y Graph dialog accessed by selecting Trace then Graph Settings as shown below.
The dialog below is displayed and is used to configure stimulus-response measurements for the active trace. These settings only apply to graph traces.
Graph Settings Tab Trace x - Select the trace to apply the settings.
Visible - Check to make the trace visible. Copy To... - Copy these settings to multiple traces. Auto - Check to have the 89600 VSA choose a valid stimulus and response automatically. Stimulus Data - Selects the measurement channel corresponding to the stimulus (x-axis) time data to use in the graph trace. Response Data - Selects the measurement channel corresponding to the response (y-axis) time data to use in the graph trace. Compensation - Check to perform amplitude normalization, time alignment, and phase error compensation before calculating the points for a graph trace. After compensation, a polynomial curve is fitted to the data if Polynomial is checked. Time Reference - Determines whether the time axis of the graph trace corresponds to other graph traces or to the original data before compensation. Draw As - Specifies how to draw the points in the active trace. This parameter only applies to graph traces.
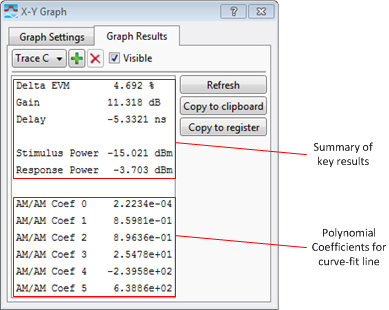
Graph Results Tab The Graph Results tab shows information about the graph calculation for the active trace.
Refresh - Refreshes summary results from trace. Copy to clipboard - Copies summary results to clipboard. Copy to register - Copy polynomial trace to data register.
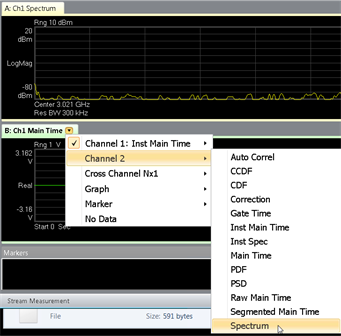
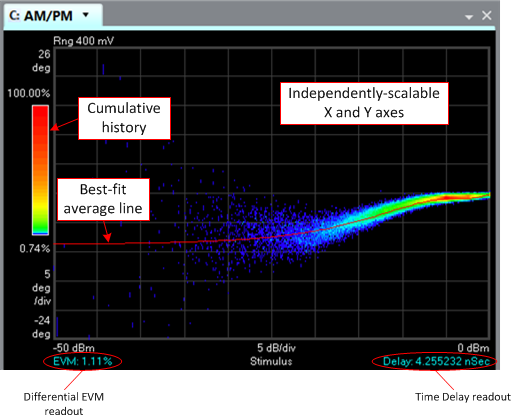
Selecting a Graph Selecting the down arrow (or right-clicking) on the trace window tab as shown below accesses the various graphs for the active trace. The graph selection below would select an AM/PM graph specific to trace "C".
The results below show a typical AM/PM graph.
Note: For more information, refer to the 89600 VSA online help.
|
|
|
|
There are several methods that can be used to switch between the PNA/PNA-X interface and the 89600 VSA interface.
Windows Taskbar In the Windows Taskbar, click on the PNA/PNA-X or 89600 VSA icon.
VSA Toolbar While viewing the PNA/PNA-X interface, click on the Show VSA button in the VSA toolbar.
Alt-Tab Using an external computer keyboard, press and hold the Alt key and press the Tab key to switch between applications.
External Monitor With an external monitor connected to the PNA/PNA-X, view the PNA/PNA-X interface on the PNA/PNA-X display and the 89600 VSA interface on the external monitor.
|
|