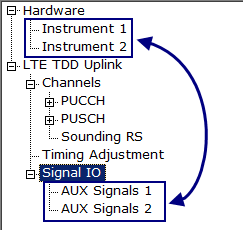
Use this node to monitor and troubleshoot signals such as Timing Adjustment and HARQ ACK/NACK. When using multiple instruments as shown in the ![]() tree view, the software displays as many AUX Signals nodes as there are instruments showing. The AUX Signals nodes are numbered relative to the instrument numbering shown under the Hardware node and provides information for only the instrument it matches numerically.
tree view, the software displays as many AUX Signals nodes as there are instruments showing. The AUX Signals nodes are numbered relative to the instrument numbering shown under the Hardware node and provides information for only the instrument it matches numerically.
|
1. AUX Signals Settings |
2. AUX Status |
3. Signal Generation Status |
|---|---|---|
|
|
||
|
|
|
|
|
This button indicates that the current real-time settings have been applied to the instrument—no action is required. This button is not available when the Apply Needed button is active. When using multiple instruments as shown in the tree view, this button is not displayed. |
|
|
This button displays in place of the Settings Current button. It indicates that the instrument settings are not currrent and need to be updated with the new software settings. Click this button to update the insturment's settings. This button shows in all windows regardless of where the change was made. When using multiple instruments as shown in the tree view, this button is not displayed. |
|
|
Use this button to query the selection made with the Query Type parameter. The query results are static and will not be updated until the button is clicked again. Performing a query does not erase the results of queries from other different Query Type selections. This button is active after setting State to On and initiating the signal with the State On button. When multiple instruments are controlled by the software, the Query Data button is specific to the instrument with the same number as shown with the AUX Signals n node. The query results comes from data that is stored in a buffer. The buffer contains information on the Query Type selection for up to 1024 frames (10.24 seconds). The software begins storing the information when the Query Type selection is made. If the query is started too soon, there may not enough stored data for evaluation. Once the buffer capacity has been reached, the software overwrites existing buffer data. Graph details and data from queries are not saved when using the Save as feature to save the software setup to a settings file. To save queried data, use the Save Data button. |
|
|
Use this button to save the data from the query to the file shown in the Data Save parameter. This button is active when the following conditions have been met:
|
Choices: Off | On
Default: Off
Coupling:
On makes the Query Data button active.
When the software is controlling multiple instruments, changing this parameter in one AUX Signal node, changes it in all AUX Signal nodes.
Double-click or use the drop-down menu to select the AUX Signals monitoring state.
Choices: AUX Active Status | HARQ ACK/NACK | Timing Adjustment | AUX Serial Monitor | Marker Monitor
Default: AUX Active Status
Coupling: When the software is controlling multiple instruments, changing this parameter in one AUX Signal node, changes it in all AUX Signal nodes.
Double-click or use the drop-down menu to select the monitor type for the AUX Monitor query. Most of the selections provide the query results at the bottom of the window in a graph, as data bits, or both (multiple tabs showing)
|
AUX Active Status |
This choice enables a query of the AUX pins signal status. |
|
HARQ ACK/NACK |
This choice enables a query of the PUSCH HARQ ACK/NACK bits. Up to a maximum of 16,384 bits are recorded. This means that all ACK/NACK bits for the uplink PUSCH subframes are recorded, even if they are off. The query results are displayed in three tabs, Overview (graph), Data, and Process:
|
|
Timing Adjustment |
This choice enables a query of the Timing Adjustment command counts between queries (Query Data button clicks). The query results are shown in 2 tabs, Overview (graph) and Data:
|
|
AUX Serial Monitor |
This choice enables a query of the AUX serial data. The results, up to 2,048 bytes of serial data, are displayed in the Data tab. The Data tab shows all of the commands that the AUX IO has received in hex format:
|
|
Marker Monitor |
This choice enables a query of the active AUX marker signals specified in the Signal IO node. The results capture up to 4,096 marker events and are displayed in a graph (Overview tab). With each marker query, the marker graph also shows the frame pulse. |
Choices: Off | User File
Default: Off
Coupling: This must be set to User File as one of the conditions to make the Save Data button active.
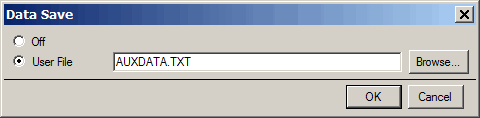
Set whether the software saves the query data. To change the selection, click the parameter and then the  button to launch the Data Save
 ![]() dialog box. When User File is the selection, in the dialog box, enter a file name, manually enter a path and file name, or use Browse... to locate a previously saved file and select it as the file to save the data too. The software saves the query file to My Documents on your hard drive, or to the location manually entered or specified by using Browse.. to select the previously saved file.
dialog box. When User File is the selection, in the dialog box, enter a file name, manually enter a path and file name, or use Browse... to locate a previously saved file and select it as the file to save the data too. The software saves the query file to My Documents on your hard drive, or to the location manually entered or specified by using Browse.. to select the previously saved file.
Static display of the AUX port pins signal state (active/inactive). Use the Query Data button to see if there has been any changes to the AUX port pins signal states. This parameter updates with every query, even when AUX Active Status is not the Query Type selection. The order of the displayed bits is b15...b0.
|
0 |
AUX pin low (inactive), stayed low between queries. |
|
1 |
AUX pin high (active), stayed high between queries. |
|
0* |
AUX pin state changed to low since the last query. |
|
1* |
AUX pin state changed to high since the last query |
Coupling: Requires that the Query Type be set to Timing Adjustment.
Displays the Timing Adjustment value in [Ts] since the last Timing Adjustment query.
Coupling: Requires that the Query Type be set to Timing Adjustment.
Displays the Timing Adjustment count since the last Timing Adjustment query.