Error Vector Spectrum (802.16 OFDMA)
shows the signal RCE Relative Constellation Error is the RMS level of the Error Vector Magnitude, averaged over all subcarriers and all detected OFDM symbols. (EVM Error vector magnitude (EVM): A quality metric in digital communication systems. See the EVM metric in the Error Summary Table topic in each demodulator for more information on how EVM is calculated for that modulation format.) vs. time and frequency. It provides both the RMS average Error Vector Magnitude and the individual Error Vector Magnitudes (EVM) for each subcarrier for all symbols within the analysis zone. The individual symbol EVMs are displayed by common subcarrier number--that is, for a particular subcarrier all the symbol EVMs for that subcarrier are shown. This provides a convenient way to view all the subcarrier EVMs at a particular subcarrier for all symbol-times in the burst. The trace data includes data results for the pilot and data subcarriers, subcarrier 0 is not used. Inactive subcarriers may or may not be included, depending on the Include active subchannels selection.
Symbol EVM is the error vector magnitude difference between the measured (IQ Meas) symbol vector and an ideal (IQ Ref) symbol vector. RMS Error Vector Spectrum trace data is the average error vector magnitude of all the symbol EVMs at a particular subcarrier for all symbol-times within the burst.
The number of symbol-times included in the data results can be modified (or limitted) with the Overrride Measurement Region parameters. The TimeLen value on the trace data shows the number of symbol-times included in the data results.
Interpreting the trace data
The y-axis annotates the EVM magnitude and the x-axis annotates the OFDMA Subcarrier number, the range is determined by the zone definition (unless limited), subcarrier 0 is not used. The z-axis annotates the symbol position. The trace data format shows all the symbols at a particular subcarrier, for all the symbol-times within the burst. Placing a marker on a subcarrier provides the subcarrier number, the analysis burst name, the symbol number, the subcarrier EVM (for that particular symbol) and the RMS average EVM (for that particular subcarrier).
The trace uses a multi-color display to distinguish the various symbol data results including the analysis zone defined data burst symbols, the pilot subcarriers, and the RMS (average) EVM trace, see About Trace Data for more information.
Example Error Vector Spectrum trace data: Demodulated IEEE Institute of Electrical and Electronics Engineers. A US-based membership organisation that includes engineers, scientists, and students in electronics and related fields. The IEEE developed the 802 series wired and wireless LAN standards. Visit the IEEE at http://www.ieee.org 802.16 OFDMA DL Down Link (forward link: from base station to cell phone)-PUSC partial usage of subchannels: Some of the subchannels are allocated to the transmitter. signal.
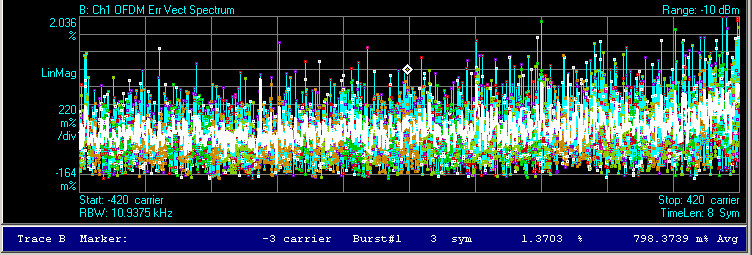
Trace B: Ch1 OFDMA trace data, Marker Readout:
-
Subcarrier number: -3
-
Data Burst Name: burst#1
-
Symbol number: 3
-
Symbol EVM: 1.3703 m% (for symbol 3 at subcarrier -3)
-
RMS Average EVM: 798.3739 m% Avg (all symbols at subcarrier -3)
See Also