Band Power Markers Overview
Band-power markers provide a quick way to make several different power computations. This topic includes the following information:
Band power markers
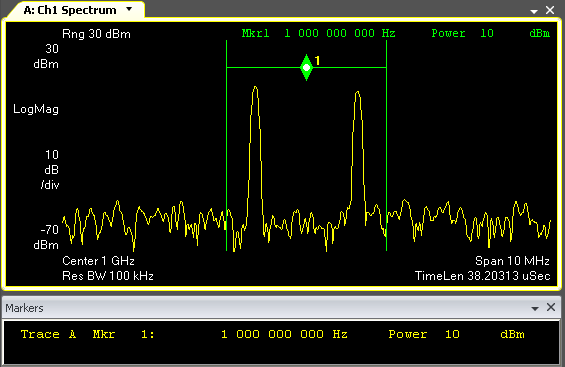
This screenshot shows band power marker on a spectrum trace (the trace grids are turned off so it is easier to see the marker):

The band power marker consists of two solid vertical lines spaced equally on either side of a marker diamond. The two vertical lines indicate the left and right band edges. The bottom point of the diamond shape indicates the center of the band. The Y position of the marker shape depends on the Y-axis Trace Format selected for the trace.
For Lin Mag, Log Mag, and Log Mag (Lin) trace formats, the band power marker is shown at the Y-axis position corresponding to the mean band power, regardless of the settings of the band power type and band power calculation.
For Real, Imag, Group Delay, Wr Phs, and Un Phs the band power marker diamond is shown at the actual Y-axis position shown in the Markers Position tab.
For other trace formats, band power calculation is not available.
The results of the band computation are shown in the Markers Window. The active marker's value is also shown above the trace grid to the right.
Creating a band power marker
There are several ways to create a band power marker on a trace:
-
Right-click in the trace and select Show Band Power from the menu.
-
Click the band power tool
 in the tool bar. Then click in the trace where you want the band center to be.
 -
Click and select the check box.
-
Click the select area tool
 and then move the mouse to a trace grid. While left-clicking the mouse, drag over the frequency band of interest and release the mouse button. From the menu that appears, select Band Power. A band power marker will be placed over the selected area.
Positioning a band power marker
Change the position of a band power markers in the following ways:
-
Using the mouse
-
Using the Markers menu
Using the mouse
-
To move the center frequency, select the band power tool
 or the marker tool
  and click in the trace to position the band power marker center.
 -
To maintain the band center but change the width, place the pointer on left or right edge of the band power marker and drag to the desired width. The center remains fixed.
Using the Markers Calculation tab
-
Click . When the check box is selected, the position of the band power markers is determined by these two settings:
-
determines the center position of the band-power markers.
-
determines the width of the band-power markers.
-
-
When the Center/Span check box is cleared, the position of the band power-markers is determined by these two settings:
-
determines the location of the left band-power marker.
-
determines the location of the right band-power marker.
-
Band-power marker calculations
Make the following band power calculations using the band-power markers:
-
Power: the average power between the band power marker's left and right edges
- Power Density: the average power density for the band
-
RMS Sqrt (Pwr): the square root of average power between the band power markers
-
C/N See carrier-to-noise ratio.: carrier-to-noise
-
C/No: carrier-to-noise density
See Performing Band Power Measurements more information.
For OFDM Orthogonal Frequency Division Multiplexing: OFDM employs multiple overlapping radio frequency carriers, each operating at a carefully chosen frequency that is Orthogonal to the others, to produce a transmission scheme that supports higher bit rates due to parallel channel operation. OFDM is an alternative tranmission scheme to DSSS and FHSS. trace data, the band power calculations are calculated from the 2D Average Line, which shows the average of Z-axis points at each X-axis location.
See Also
