Error Vector Spectrum (TEDS)
shows the Error Vector values by subcarrier, with each colored vertical line containing all of the symbols for each subcarrier. Then the whole display is overlaid with a white trace (LinMag and LogMag only) showing the average vector error of each subcarrier. The example below shows a Normal Uplink, 50kHz channel bandwidth (16 subcarriers,-8 to 8) signal. See TEDS Subcarriers for more information on the number of subcarriers for each channel bandwidth.
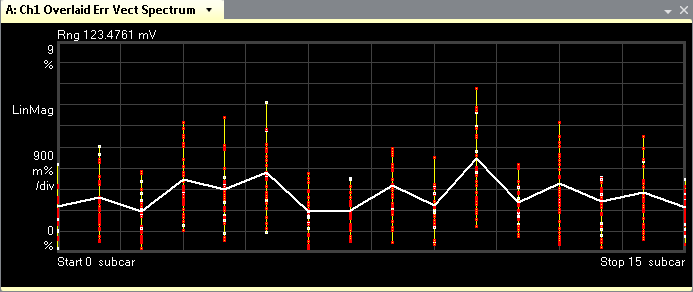
The symbols are stacked in order of % EVM Error vector magnitude (EVM): A quality metric in digital communication systems. See the EVM metric in the Error Summary Table topic in each demodulator for more information on how EVM is calculated for that modulation format. error with the symbol with the highest error on top and the symbol with the lowest error on the bottom. The symbols included in the EVM are shown in red and those not included are shown in white. See the Color Tab of Display Preferences dialog box to set the colors for the following: symbol colors, average trace colors and pilot colors. (The pilot color is the color of the symbols not included in the EVM calculation and can be headers, syncs, or pilots.) Since this example trace shows a Normal Uplink, 50kHz (16 subcarriers), 16QAM slot format signal, there are 16 vertical lines (-8 to 8, left to right) and 31 symbols per vertical line (often piled on top of each other). The white trace shows the average % EVM error from subcarrier to subcarrier and is a good way to view the subcarrier EVM for all the subcarriers at once. This trace provides a quick view of what subcarriers and symbols are contributing to the composite EVM.
Select to scale the trace. If the trace shows NO DATA, check your recorded signal or hardware input and TEDS demod properties. TEDS demod parameters Droop and Pilot Tracking affect this trace. The above trace shows a LinMag (linear magnitude) scale. To change scales, see t and choose from the format drop-down menu.
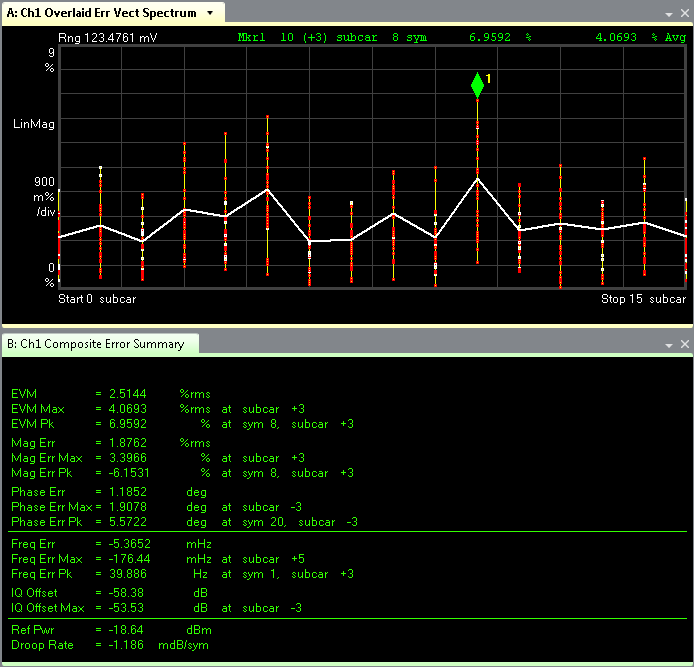
The display below shows how to correlate the composite , which shows at symbol 8, subcarrier+3, with the trace. For the trace, select to view the Marker on the trace. Once you have a marker on a subcarrier trace, use your up, down, left, and right arrow keyboard keys to move the marker through the subcarrier symbol stacks where the display shows each symbol position at the bottom of the display The marker readout gives the value of the EVM point as well as the white line (average for that subcarrier). Also, reports the highest point of the white overlaid line, that is, the subcarrier with the greatest overall EVM error (subcarrier+3 for this example).
The following screenshot was taken with Droop, Header Symbols, and Sync/Pilot Symbols included in the Error Summary trace calculations.
See Also