Beginning with PLTS 2018, the Python interface is supported for mathematical calculations. A Python installer is included with the PLTS software which installs Python 3.6.2.
Beginning with PLTS 2021, the Python interface supports Python 3.8.
In this topic:
Click Tools, then Math, then Collaborate with Python.
See Example of how to use this feature. In this dialog, you specify the parameters to send to the Python function, and the variable name in which the resulting data will be stored. Python File - Navigate to a *.py file which contains the variables to be mapped to data. Note: There can be NO spaces in the entire path name of the Python *.py file. Beginning with PLTS2019, two new functions have been added called MDNEXT and sumDiff. These functions enable the following:
MDNEXT The Sp1 and Sp2 variables are required. Additional variables are optional.
sumDiff
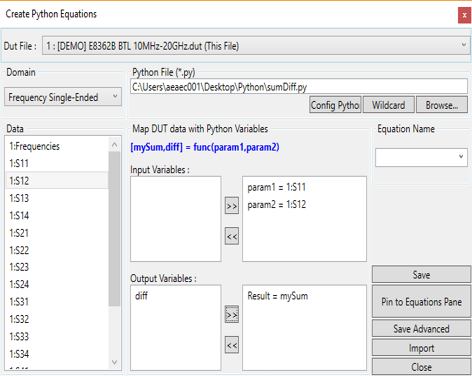
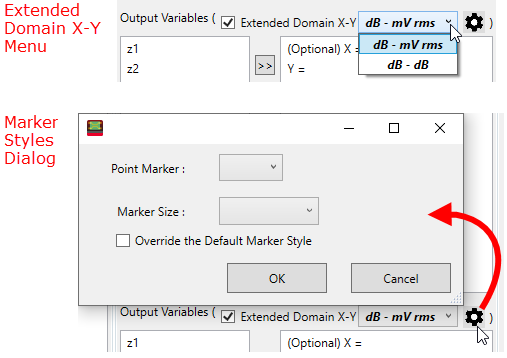
Domain - Choose the domain data to map. Select from Frequency Domain (single-ended and balanced) and Time Domain (single-ended and differential). Data - Click a parameter, then click a variable, then click >> to associate the data with the variable. Equation Name - Enter a name to save the equation and recall it for future use. Output Unit - Set the output units to No unit, Ohms, or dB. Config Python... - Accesses the Python Configuration dialog for selecting the file path to the Python executable file. Wildcard - Replaces file number with '?' when the file number is not the same as when the equation was first written. Browse - Specifies the path to the *.py Python function file. Extended Domain X-Y - Mark the checkbox to enable the X-Y units selection from the drop-down menu. Choices include: dB - mVrms and dB - dB. When the checkbox is not marked, then the X and Y units depend on the input data and output unit settings in the GUI. In this case, the X unit could be ns, cm or GHz, and the Y unit could be dB, Ohms, U etc. The gear icon opens a marker-styles dialog, but only applies when the equation output is just a single point in the plot.
Save (Equation) Saves the valid math equation into PLTS memory. NOTE: This does NOT save the equation to disk. Pin to Equations Pane - Attaches the Python equation to the Equations pane for easy selection. Save Advanced Launches the Save Equations dialog, which allows you to save the equation to a *.DUT file or a *.fml (equation) file. Import Launches the Open dialog. Navigate and select a *.fml (equation) file to load. After opening the file, select the file using Equation Name. Close Closes the dialog. |
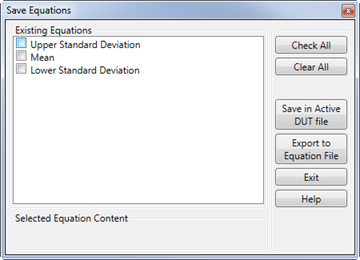
This dialog is started when Save Advanced is clicked on the Create Equations dialog.
Existing Equations - The equations that are in PLTS memory are listed. Select (check) the equations to be saved to disk. Check All - Select (check) all of the listed equations. Clear All - Unchecks all equations.
|
In Python, create a new .py file, name it “plts_demo.py”.
In that file, define the following function:
# -*- coding: utf-8 -*- def plts_demo(frequency, s21): return s21; |
Save the *.py file to a location with NO SPACES. For example: C:\plts_demo.py.
In PLTS, click File, then Import , then Single File.
Click Browse, then navigate to C:\Program Files (x86)\Keysight\PLTS2018\Data\[DEMO] E8362B BTL 10MHz-20GHz.
On the Select Analysis View dialog, select Frequency Domain (Single-Ended).
Click Tools, then Math, then Collaborate with Python.
In the above dialog, click Browse, then navigate to the file that was saved in step 3 (“plts_demo.py”).
In the Data column, select a data set (2:Frequencies in the above image).
In the Input Variables field, select a variable (S21 in the above image).
Click >> to associate the data with the variable.
Click on the Config Python button and ensure that the correct path to python-3.6.2 is entered.
In Equation Name, type S21_Demo.
Click Save
Click Close
Select (double-click) the S21 plot.
Click Tools, then Math, then Apply.
In the following dialog, select S21_Demo then click Apply.
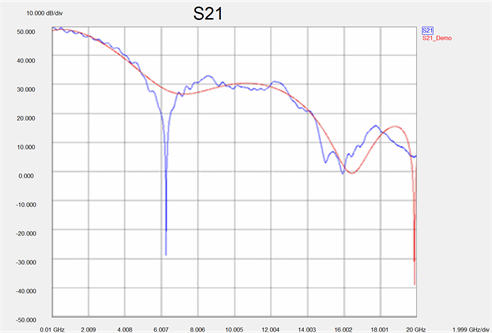
The S21_Demo trace is added to the S21 plot as in the following image:
Beginning with PLTS2019, two equations for power integrity have been added:
Refer also to the Power Integrity Formats.
Beginning with PLTS 2022, Power Sum Crosstalk equation have been added.
This PSXT is a 8-port equation example written in the Python script. User can go to the Python equation to have parameter remaps for other ports.
Accessing Equations
Click Tools,
then Math, then Apply
to access the Choose Equation Traces
to Display:
or
In the Parameter
Format Selection, select Equation
to access the Equations Pane:
Series-Through Method
The following equation is the series-through method of measuring a power plane:
Shut-Through Method
The following equation is the shunt-through method of measuring a power plane:
Beginning with PLTS2019, start and stop equation limits in the frequency domain are supported in Python equations.
Python output variables need to output both frequency and S-parameter:
Last Modified:
16 Jan 2024 |
Added Output Unit drop-down menu, supporting dB, and support for dB-dB output plot |
22 July 2022 |
Added PSXT equation |
7-Dec-2020 |
Added PLTS2021 support for Python 3.8 |
7-Dec-2018 |
Added power integrity equations and equation based limits |
8-Nov-2017 |
New topic in PLTS2018 |