Data Format and Scale
Format and Scale are display functions which can be selected for each
plot to learn more about your measurement data.
Data Format
A data format is the way PLTS presents the measurement graphically.
Select a data format appropriate to the information you want to learn
about the device.
See the data formats that are available for:
Data format can NOT be selected for Eye
Diagrams or Transmission
Line Parameters.
How to select
Data Format
Any of the following methods can be used to change the format for the
plot.
Frequency Domain Formats and
Units

|
Log
Mag displays Cartesian logarithmic magnitude (no phase)
in dB. Typical measurements are return loss and gain. This is
the default format. |

|
Linear
Mag displays positive values only in mU. Typical measurements
are transmission, reflection coefficients, time domain transfer. |

|
Phase
displays phase (no magnitude) in degrees. The trace 'wraps' every
180 degrees for easier scaling. |

|
Unwrapped
Phase displays phase in a single, continuous, display.
The phase is not reset every 180 degrees. This helps to see the
minor changes from a linear phase response. |

|
Group
Delay displays signal transmission (propagation) time through
a device in nanoseconds (nS). |

|
Smith Chart displays an impedance
plane that is mapped onto the polar plane. Every point on the
Smith Chart represents a complex impedance made up of a real resistance
(r) and an imaginary reactance (r + jX). The dotted circles represent
constant resistance. The horizontal line through the middle is
purely resistive (no reactive component). No units.
To the far right, the value is zero
ohms (short). To the far left, the value is infinite
ohms (open).
The
dotted arcs represent constant reactance.
The reactance arcs in the upper (positive)
half of the circle represent inductive reactance (ZL
= jwL). The reactance arcs in the lower (negative)
half of the circle represent capacitive reactance (ZC = 1/jwC). Typical measurements: Impedance profile
When
in this format, the cursor bar allows you to choose the cursor
value in either Mag + Phase or Inductance style. Refer to Frequency
Domain Polar and Smith Chart Markers for additional
information. |

|
Polar Chart plots the
measurement result in a vector representation. No units.
The magnitude at
any point is determined by its displacement from the center
(or zero value). Magnitude is scaled linearly, with the value
of the outer circle set to a ratio value of 1. The radial lines
scale the phase angle from 0 degrees to +180 degrees (counterclockwise)
or -180
degrees (clockwise). When in this format,
the cursor bar allows you to choose the cursor value in either
Mag + Phase or Inductance style. Refer to Frequency Domain Polar
and Smith Chart Markers for additional information. |

|
Real
displays only the real (resistive) portion of the measured complex
data in mUnits. Can show both positive and negative values. Typical
measurement: time domain |

|
Imaginary displays
only the imaginary (reactive) portion of the measured complex
data in mUnits. Typical measurements are impedance for designing
matching circuits. |

|
SWR Standing wave ratio.
|

|
Impedance (Z) Real The
rectilinear version of the same Real (resistive) data that is
displayed on a Smith Chart. |

|
Impedance (Z) Imaginary The
rectilinear version of the same Imaginary (reactive) data that
is displayed on a Smith Chart. |

|
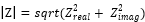
Impedance Magnitude displays
the magnitude of impedance.
|

|
Impedance Imaginary Magnitude
displays the magnitude of the imaginary part of impedance.

|

|
Impedance Angle
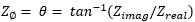
|

|
Quality Factor
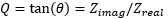
|

|
Dissipation Factor
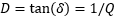
|
Time Domain Formats
and Units
Stimulus
- Type of the input to the DUT |
 |
Impulse |
inputs an impulse waveform
as the stimulus. |
 |
Step |
inputs a step waveform as the
stimulus. This is the default format. |
Vertical Format
- Units used on the vertical axis |
 |
Volts |
selects volts as the vertical
unit of measure. This is the default format. |
 |
Real |
displays only the real (resistive)
portion of the measured complex data. Real can show both positive
and negative values. This is the default format. |
 |
Log Mag |
displays Cartesian logarithmic
magnitude (no phase) in dB. Typical measurements are return loss
and gain. |
 |
Impedance |
selects ohms as the vertical
unit of measure. This choice is active only for reflection plots
with a Step stimulus. |
Horizontal
Format - Units used on the horizontal axis |
 |
ns |
selects time units (in nanoseconds)
for the horizontal format. This is the default format. |

|
cm |
selects distance units (in
centimeters) for the horizontal format. |
Note:
When opening measured DUT files in Time Domain to view in the
Time format:
1. Go into the time domain/distance format and set your velocity
factor accordingly (Example: Air VF=1.000, Surface traces VF=0.53146,
Buried traces in a dielectric constant (er) ~ 4.3:
VF=0.48795).
2. Select to view data in time, and then switch to view data
in distance.
This triggers the correct computations to take place and you
will now be able to set markers and measure device lengths and
discontinuities accurately.
Note: When
the horizontal units per division is changed, the Delay value
is reset to zero. |
Transmission Line Parameters
When the plot is inductance, the units are in Henrys
When the plot is resistive, the units are in Ohms.
Setting the Scale of a
Plot
Note: Eye
Diagrams do NOT allow the scale to be changed.
Use the following methods to make scaling changes:
Manually
Autoscale
Reset Scale
Zoom
Pan
Copy
and Paste Plot Format
Change Scale Manually
PLTS allows you to change the horizontal and vertical scale of plots
using the Scaling Bar.
How
to show or hide the Scaling Bar
Click View, then Toolbars,
then Scaling Bar.
Click in any of the scale boxes. Then do one of the following to change
the horizontal and vertical scale.
Click or hold the up/down arrow buttons to the right
of each entry.
Use a mouse scroll wheel to increment or decrement
values.
Type a new value. Units can also be entered, but defaults
to the units currently displayed.
Change the step size of the Horizontal or Vertical
settings as follows:
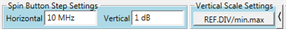
Click the right-arrow, shown in yellow shading
in the above image.
Enter new step size.
Click left arrow to hide the Step Settings.
- Click on
the Vertical Scale Settings button to change between Ref Level-Units/Div
to Min/Max mode. Min corresponds to the bottom of the vertical scale
and Max to the top of the vertical scale.

Scale Notes
You can not extend the start and stop frequencies
beyond the start and stop frequencies used in the measurement.
The horizontal scale may not be changed in Smith Chart
and Polar formats.
Learn how to set the Time
Domain Start and Stop values.
Autoscale
Autoscale changes the vertical scale
of the active plot to allow the trace to occupy approximately 80% of the
vertical axis of the display.
Note: You can select
a User Preference to Autoscale each plot as it is created. Learn
how.
Select the plot, then Right click
on the plot to display the following menu.
Reset Scale
Reset Scale resets the vertical and
horizontal scale of the active plot to the default settings. This
is useful when you are adjusting the scale and the trace is moved off
screen and can no longer be seen.
How to Reset the scale
Click and Drag Zoom
Note: The zoom
feature is not available for Eye Diagrams, Polar or Smith Chart plots.
To zoom in on an area of the active plot:
On the Plot
toolbar, select the Zoom
icon 
Click within the plot and drag the mouse, creating
a rectangle as the mouse is moved.
Release the mouse button to enclose the area of interest.
The displayed plot now has new X-axis and Y-axis scales.
If necessary, right-click on the plot, then select
Autoscale
to set the Y-axis scale so that the data is better displayed.
To return the plot to the original horizontal and
vertical settings, right-click on the plot and select Reset
Scale.
Pan (traces)
Changes the scale for the X-axis and Y-axis to effectively move the
traces within a plot.
On the Plot
toolbar, select the Pan
icon .
Click within the plot and drag the mouse.
Optionally, with the Plot
icon selected, hold the shift key while clicking and dragging the
mouse within the plot.
If necessary, right-click on the plot, then select
Autoscale
to sets the Y-axis scale so that the data is better displayed.
To return the plot to the original horizontal and
vertical settings, right-click on the plot and select Reset
Scale.
Copy and Paste Plot
Format
You can change the plot format quickly using the Copy/Paste Plot Format
functions. These functions are very useful when you are displaying several
traces within a plot window.
To perform Copy/Paste Plot Format functions:
With your data plots displayed, make any changes in
the format or scale of the plot to be copied. In this example,
the format of TCC12 was changed from step to impulse and the vertical
scale was changed.
With the cursor over the plot to be copied, right-click
the mouse button, then click Copy
Plot Format.
With the cursor over the plot to get the new format
and scale, right-click mouse button, then click Paste
Plot Format. The plot is now displayed with the new format
and scale.