Most of the items on the PLTS screen can be turned ON and OFF from the View menu.
Click an area on the image below to learn more:
![]()
In addition to Physical Layer Test System (PLTS), the title bar also displays the file name of the data in the active plot window if the data has been saved. The data analysis type of the active plot window is also displayed. At the right side of the title bar, buttons are also provided quickly perform window operations (minimize, full screen, partial screen, and close) at the program level.
![]()
The menus change to reflect appropriate choices for the current settings and data analysis type of the active plot window.
When the active plot window is maximized, completely filling the plot area, the menu bar also displays three buttons to perform window operations (minimize, full screen, partial screen, and close) on the plot window.
On the Menu bar, click View then Toolbars to turn the following toolbars ON and OFF: A check means the toolbar is ON.
The Upper Pane docking area is 'home' (by default) to the following PLTS Panes:
Learn how to move and re-dock the panes.
The Data Browser pane allows you to view various types of data.
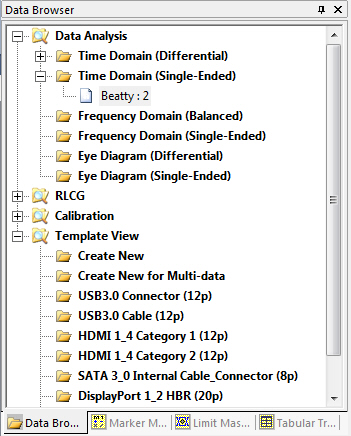
Select a Data Analysis type to open a new window. Learn more about Windows, Plots, and Traces.
Select or create a new Template View. Learn more.
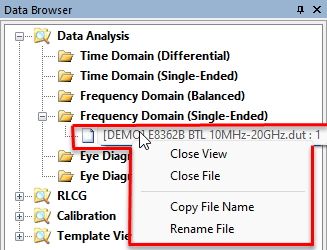
RIght-click any file in the Data Browser pane to open a menu of various file-management actions.
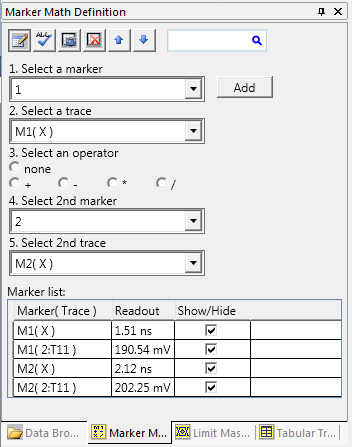
This pane is used to add or change marker math or reorder the marker readout.
Important: First create standard markers using the marker bar at the bottom of the screen.
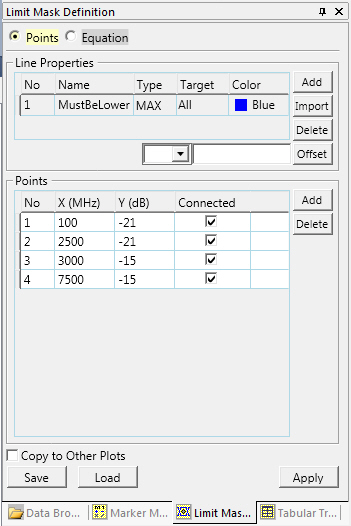
Define and apply Limit Lines. Learn more.
Define Mask settings for Eye diagrams. Learn more.
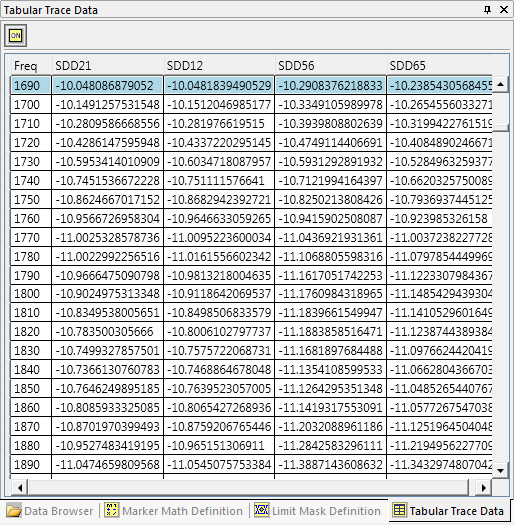
This pane displays the data of the active plot in tabular form.
The Lower Pane docking area is 'home' (by default) to the following PLTS Panes:
Parameter Measurement Result (Eye diagram)
Learn how to move and re-dock the panes.
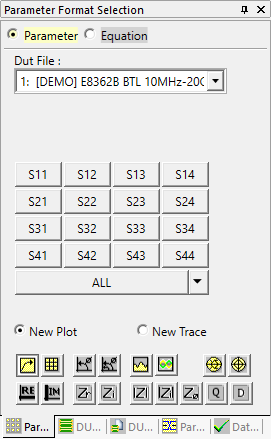
The parameter / format pane allows you to open a new plot, add a new trace to an existing plot, select a format for each plot, and perform a Data Integrity check. The following image shows the parameters for the Differential time domain plots. Each analysis type has unique parameters specific to that type of analysis.
These selections can also be made from the Data menu.
Learn more about selecting parameters.
See this pane when viewing Eye Diagrams.
Click Parameter to select parameters and format.
The format bar allows you to format the parameters for the active time domain or frequency domain plot window.
These selections can also be made from the Format menu.
Learn more about setting plot format.
Click Equation to show the Equations Pane.
Learn how to show Math Equations on this pane
Displays the DUT topology of the currently selected data as shown in the Data Analysis Browser Window.
Shows information about the currently selected measurement.
Shows Eye Diagram measurement results. Learn more.
Check and correct (enforce) the validity of displayed data. Learn more.
The marker bar allows you to display markers on the active plot. The X-Y values of each cursor are displayed at the right edge of the plot.
The eye diagram marker bar and the frequency domain polar and Smith chart marker bars differ slightly.
The marker bar can be moved to the top of the PLTS screen by clicking on, then dragging the bar to the desired location. It always appears at the bottom of the display when PLTS starts.
For more information, see Markers.
![]()
The plot area displays measurement results in the selected data analysis type. You select the data analysis type when you make a measurement, open existing data files, or make a selection in the browser. Learn more about Working with Windows, Plots, and Traces
![]()