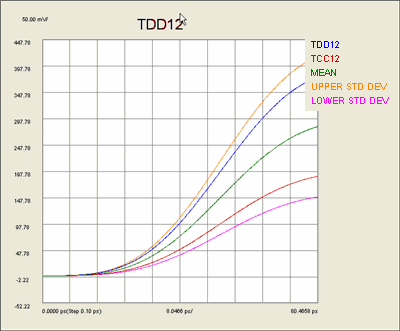
The TDD12 and TCC12 traces were measured.
The MEAN, UPPER STD DEV and LOWER STD DEV traces were added.
Statistical equation traces allow you to plot an additional trace from the existing traces in a plot that represent the Mean, Upper, and Lower Standard Deviation of the existing traces.
|
The TDD12 and TCC12 traces were measured. The MEAN, UPPER STD DEV and LOWER STD DEV traces were added. |
Add the traces on which statistical analysis is to be performed. Learn how.
Select one or more of the statistical equations.
Click Apply to add the selected trace to the active plot.
The statistics are calculated for each data point of all traces in the active plot window.
Calculations and plotting of the statistical traces occurs real time. Additional measurement traces can be added or removed and the statistical traces are updated automatically.
The UPPER and LOWER Standard Deviation values are determined as follows:
MEAN = Average of traces
UPPER = Mean + (Std Dev / 2)
LOWER = Mean - (Std Dev / 2)
Calculations are performed on any number of existing traces up to the PLTS maximum. The statistical traces are counted towards the maximum number of traces per plot.