Learn about specific characteristics of the data analysis types:
Learn your way around the PLTS display.
Learn about View Settings (Toolbars, Panes, Status)
Note: Before data can be displayed, it must be measured or loaded from a DUT file into PLTS. See File Save and Open
A PLTS window contains measurement plots.
There is no PLTS limit to the number of files or windows that can be opened. However, your Operating System probably has limitations.
Windows can be Maximized, Tiled, Cascaded, or Minimized, from the Window menu.
A window contains plots of a single DUT file, and of a single Data Analysis type.
Up to 144 plots can be displayed in each window.
The Data Analysis Browser allows you to view available data in one or more Data Analysis types. Selecting a new Data Analysis type from the browser opens up a new window.
Click a Data Analysis type, such as Time Domain (Differential), to open a new blank window. Then, from the Parameter Tab, select PLOTS to display in that window.
Click the minus sign (-) to hide the data windows that are currently open.
Click the plus sign (+) to show the data windows that are currently open.
Data Analysis types without a (+) or (-) have no open windows.
The shaded .dut file indicates the active window.
Do one of the following to close a window
Click the X in the upper-right corner of a window.
In the Data Browser, right-click on a window, then click Close View.
The following image shows two tiled windows.
Up to 144 plots can be displayed in each window. The image above shows 16 plots in the left window.
The plot with the green [Brackets] is the Active plot.
With 144 plots displayed, attempts to add an additional plot are ignored. First delete a plot by selecting the plot and pressing the keyboard Delete key.
From the parameter tab (shown below), select parameters (traces) to be added to a new or existing plot.
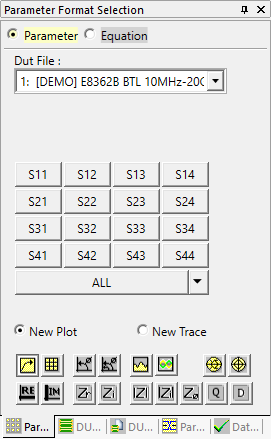
DUT File Select the data set from which to select and view parameters. The list is populated with data files that are currently open.
Select parameters to display.
New Plot - when selected, click a parameter to display the trace in a new plot. Up to 144 plots can reside in a single window.
New Trace - when selected, click a parameter to add a trace to the active window and plot. Learn more about traces.
ALL - click to add all visible 16 displayed parameters.
Use the Horizontal and Vertical scroll bars to display a different set of 16 parameters.
To REMOVE all visible plots, click All Clear.
To REMOVE one plot, select the plot to remove, the press the Delete key on your keyboard.
Click the down-arrow (next to ALL) to select from the following menu:
Note: After making one of these selections, the button is labeled with your selection. Click the button AGAIN to perform the action.
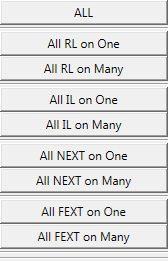
For Frequency Domain
RL Return Loss (Reflection)
IL Insertion Loss (Transmission)
NEXT Return near end crosstalk
FEXT Return far end crosstalk
For Time Domain
TDR Time Domain Reflection measurements
TDT Time Domain Transmission measurements
For All (available) parameters...
on One All traces appear on a single plot
on Many Each trace appears in a separate plot
Data sharing is viewing traces from different data files on the same plot. The traces can be for different parameters, or even different Analysis types. For example, on the same plot you can view the S11 from one DUT file and TDD22 parameter from a different DUT file.
To share data:
Beginning with PLTS 2018, 64 ports are supported.
Multiple parameters can be selected, added, or removed at once using the Select Parameters dialog. Simply click on a single parameter or drag over multiple parameters.
Click the  icon next to the Horizontal scroll bar
below the parameters to access the Select
Parameters dialog.
icon next to the Horizontal scroll bar
below the parameters to access the Select
Parameters dialog.
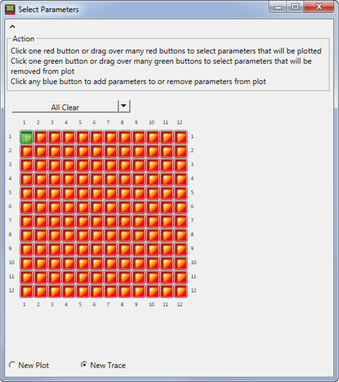
Red button - Parameter currently not plotted. Clicking on a single parameter or dragging over multiple parameters will turn the button(s) blue. Clicking on a blue button once more will add the trace(s) to the plot.
Green button - Parameter currently plotted. Clicking on a single parameter or dragging over multiple parameters will turn the button(s) blue. Clicking on a blue button once more will remove the trace(s) from the plot. The dialog above shows an S11 parameter.
Blue button - Parameter(s) to be either added or removed from a plot.
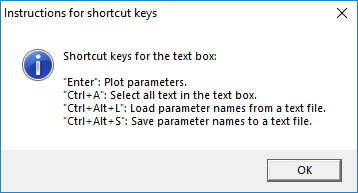
Enter parameter names: (DUT ports must be greater than 4) - Enter each parameter name in the text box separated by a comma. Traces are plotted after clicking the Add button or pressing the Enter key. Save the parameter names by clicking on the Save button or load an existing parameter name text file (*.txt) using the Load button.
Clicking on
the ![]() button accesses a list of shortcut keys:
button accesses a list of shortcut keys:
New Plot(s) - Select to display the trace(s) in a new plot.
New Trace(s) - Select to add the trace(s) to the active window and plot.
On One New Plot - Select to add the paramter(s) shown in the Enter parameter names text box to a single plot.
To display a single plot in a window, double-click the plot that you would like to view.
To display ALL plots, double-click (again) on the single plot.
Starting with PLTS2016, plots can be reordered using the mouse to drag and drop them to a new location on the PLTS screen.
 .
.Right click on a plot.
From the menu, select Copy to New Plot.
A copy of the plot with all of its traces is instantly added to your screen. The traces of the new plot have different colors applied.

A single plot may include up to 36 traces (previously 16). The above image (View Plots) shows all four reflection parameters of a 4-port measurement.
Note: You can view traces from different DUT files on the same plot.
To add new traces to a plot:
Select the plot in which to add traces.
On the Parameter Format Selection tab, select New Trace.
On the same tab, select either
the S-parameter or formula icon. ![]()
On the same tab, select the Dut File for the trace to be added.
Click the parameters you wish to add.
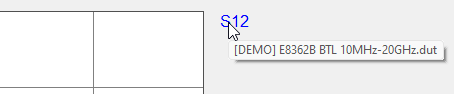
Trace names appear at the right edge of the plot.
The color of the trace title are the same color as the traces they represent.
You can select User Preferences to specify the color, line type, and line thickness of a trace.
Tip The keyboard up / down arrows, or mouse scroll wheel, can be used to scroll through the traces or markers. Each trace or marker is highlighted in order.
Available ONLY when more than one trace appears in a plot.
To remove a trace from a plot:
Right click on the trace name on right edge of the plot.
Then click Delete Trace.
or
On the Parameter Format Selection tab, click the depressed parameters you wish to remove.
By default, traces are labeled with the parameter name. These names can be changed to text of your choice. Only about the first 25 characters of the name appears on screen.
To rename a trace:
Right click on the trace or on the Name on right edge of the plot.
Then click Rename Traces.
For each trace in the plot, type a new Trace Name and click OK.
To refresh traces:
Right click on a plot.
From the menu, select Refresh Traces.
Right click on a plot.
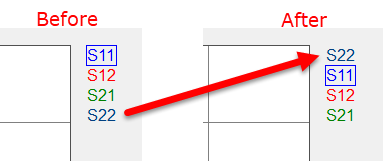
From the menu, select Change Z-Order of Traces....
A dialog appears enabling you to reorder the traces on the plot. Select a trace and use the arrow buttons to move it up or down. Click Apply when finished.
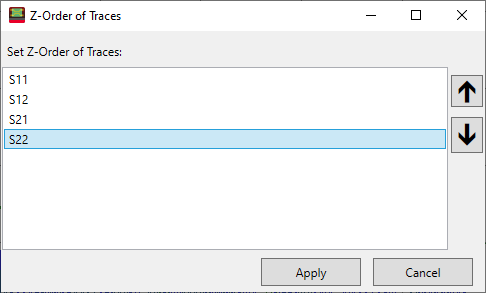
The changes appear in the upper-right corner of plot.
To add a memory trace, right-click the trace label in the upper-right corner of the plot. See below.
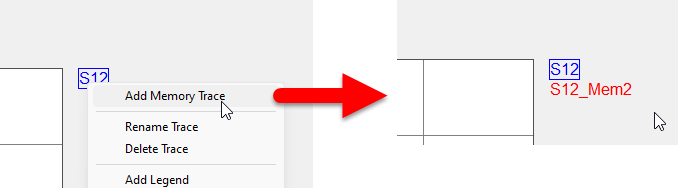
Hover your mouse pointer over the trace label to view the file name associated with it.