Trace Statistics allows you to view three statistics for each data trace.
The statistics are calculated as follows:
Peak to Peak The difference between the maximum and minimum data points. Green arrows in above image - added for clarity.
Mean The average of all data points. Green line in above image - added for clarity.
Std. Dev. The square root of the variation from the mean value. In the above example, about 68% (1 standard deviation) of the data points are within 11.05 dB of the mean value (-19.17 dB)
Select a trace for which statistics will be viewed. If viewing more than one trace in a plot, select a trace label to the right of the plot window.
Right-click, then click Trace Statistics. The following dialog appears:
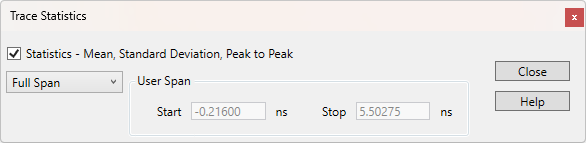
Statistics - Check to show trace statistics.
Full Span - Calculate trace statistics over the full span of the measurement.
User Span - Select, then enter the X-axis range over which trace statistics is to be calculated. Both the Start and Stop values must be a subset of the Full Span. This same User Span is used as the default setting when using a User Span for Marker Search.
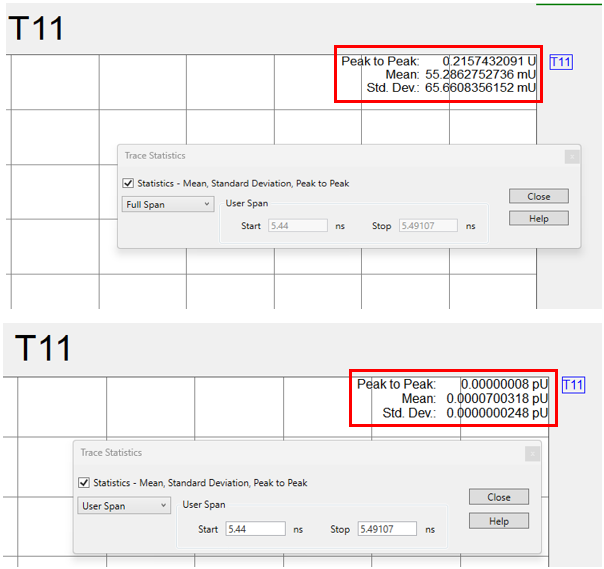
Trace statistic units scale according to the statistics data value. When the statistics data value is very small, the unit is scaled to avoid displaying many zeros.