Marker
Recall
-----------
Marker Labels
This topic discusses all aspects of PLTS makers:
Markers are applied to plots. Marker readout information for each trace in the plot is displayed along the right edge.
Refer to the following image to learn to create, select, move, save, recall, and delete markers.
Marker
Recall Marker Labels |
|
|
|
||
|
There are two ways to create a marker:
From the Marker bar on the PLTS display, select a marker, then click ON.
Right-click a plot, then click Marker, then Insert (not available in Smith Chart or Polar formats).
There are two ways to select a marker:
From the Marker bar on the PLTS display.
Click a marker. The Marker Bar at the bottom of the display reflects the currently selected marker.
There are four ways to move a marker:
From the Marker Bar on the PLTS display, select a marker and drag the slider. With the slider selected, the marker may be moved one measurement point at a time by pressing the keyboard left and right arrows.
Drag the Mx marker label at the top of each marker.
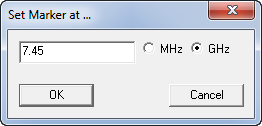
Select
the marker to move in the Marker bar, right-click in the plot, select
Marker -> Set
At..., select MHz or
GHz, then type the X-axis
value in which to move the marker (not
available with Smith Chart,
Polar, or Eye Diagrams).
Search for a specific Y-axis value on the trace. Learn more about Marker Search.
Change marker readout resolution (number of significant digits) from the User Preferences Plot tab. Learn more.
Use the marker table to select which markers to include in the readout area.
A delta marker displays data that is relative to another reference marker. Only markers #1 and #2 can be used as delta markers.
To create Delta markers, select Tools, then User Preference. On the Plot tab, check Add Delta Markers for First Added 2 Markers. When checked, as markers #1 and #2 are created, a third marker readout (shown below) displays the difference in both the X and Y axis values between these two markers.
Delta markers can also be implemented using Marker Math.
Coupled markers allow you to drag the X-axis location of one marker, and the other coupled markers move also. By coupling markers, you can view the marker readout of various formats at the same time as in the following image.
Create a marker on one plot. Learn how.
Right-click the plot, then click Marker Coupling to launch the following dialog.
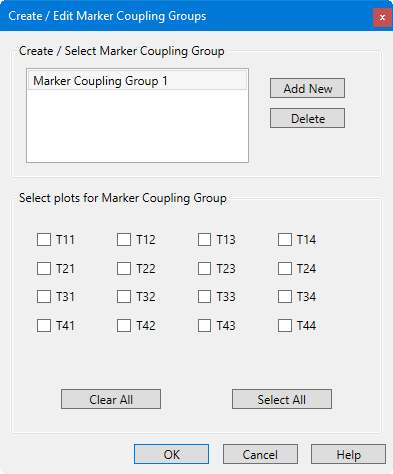
Of the currently-displayed plots, check the plots to be coupled.
To create more than one group of coupled markers, click Add New (Coupling Group).
Again, of the currently-displayed plots, check those to couple. Each plot can be checked for only one Coupling Group.
Click Clear All to clear currently selected plots.
Click Select All to select all plots for the group.
You can use a marker to search a trace for the minimum, maximum, Target Y-axis value, or 3 dB point.
To start the Marker Search dialog, right-click on a plot, then click Marker, then Search
Select a marker with which the search is to be performed. If no marker is present, one will be created.
Select the area over which the search is to be performed.
Full Span - The entire displayed X-axis.
User Span - Select, then enter the X-axis range over which the search is to be performed. Both the Start and Stop values must be a subset of the Full Span. This same User Span is used as the default setting when using a User Span for Trace Statistics.
Find the Min or Max value.
Select a marker to perform the search.
Click Minimum or Maximum.
Click Execute.
The specified marker moves to the min or max value.
Find a Target value.
Select a marker to perform the search.
Select Target Value.
Enter a Target Value to find.
Click Execute.
The specified marker moves to the min or max value.
The marker will search for the first occurrence of the target value to the right of its current position.
If the target value is above the max value or below the min value, then the target value will not be found and the marker will not move.
If a target value is present, it will likely fall between two adjacent data points. The specified marker moves to the data point closest to the target value.
Subsequent presses of the Execute button cause the marker to move to the right to search for another target value data point.
When the marker reaches the upper end of the stimulus range, it will "wrap around" and continue the search from the lower end of the stimulus range.
Find Half-Power (3 dB) Point
Available ONLY on transmission parameters.
Select a marker to perform the search.
Select Half-Power (3 dB) Point.
Click Execute.
The marker will find the maximum value, then search for the first occurrence of the (maximum value minus 3 dB) to the right of its current position.
When a marker is used in a Polar or Smith Chart format, it is essentially a point that follows the displayed trace around the chart. With a Polar or Smith Chart, select either Mag + Phase or Impedance (Real and Imaginary) on the Marker Bar.
![]()
Learn about Eye Diagram markers.
There are two ways to delete a marker:
From the Marker Bar on the PLTS display, select a marker, then click OFF.
Right-click a plot, then click Marker, then Delete. Not available in Smith Chart or Polar formats.
An entire marker set can be saved, then recalled and applied to a trace. Markers can only be recalled to the same Domain (Frequency or Time) in which they were saved.
Create Markers for a plot window.
To Save a set of markers, right-click a plot, then click Marker, then Save State. Type a name for the marker set.
To Recall a set of markers, select a saved marker name from the Plot bar.
Click ![]() on the Plot
bar.
on the Plot
bar.
Exported marker data provides an easy method to compare PLTS data in an external program. Marker data contains the number of significant digits that are specified in the User Preferences - Plot tab. Learn more.
Right-click a plot, then click Marker, then Export Data.... Selecting Marker then Export Data to Clipboard copies the data to the clipboard.
Marker data is saved to a comma-separated *.txt file.
This data can then be opened in a spreadsheet program.
Icon |
Description |
|
Show / Hide the Marker Math area. |
|
Check or clear all marker readouts. Checked marker readouts are displayed on the plot window. |
|
Export the plot and complete marker table to either a .bmp file or to the clipboard, which can then be pasted into image editing software. |
|
Remove the selected entry from the marker table. M1(1:S21) is selected in the above image. |
|
Move the selected row up or down in the marker table. |
|
Marker table search. Only those rows that contain the entered text appear in the marker table. |
This tab on the PLTS screen is used to add or change marker readouts and apply marker math.
Important: First create standard markers by right-clicking in the plot, then Marker, then Insert, or using the marker bar at the bottom of the screen.
Select a Marker Select a marker. Add markers if not already present.
Select a Trace Choose either the X axis readout or the Y axis readout.
Select Operator Select math operation to be performed on the selected markers.
Select 2nd Marker Choose a second marker to be used in the math operation.
Select 2nd Trace Choose either the X axis readout or the Y axis readout. This choice must be consistent with the step 2 selection.
Click Add to add the marker math to the marker table and to the readout.
The Marker Table filters the marker readouts that appear on the plot window.
In the following image, the Marker
Math area has been hidden by clicking ![]() .
.
Rows with Show/Hide checked appear on the marker readout area of the plot.
Filter rows that appear in the table by entering text or numbers in the search bar. For example, in the following image, only rows with 'm1' will appear in the table.
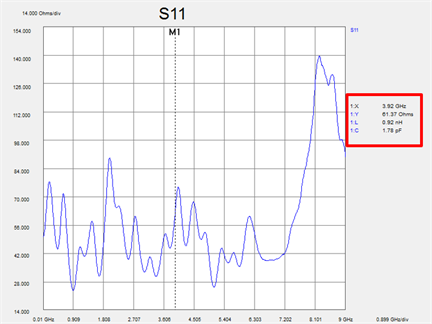
Beginning with PLTS2019, when using one of the power integrity formats, LC values at the marker position can be displayed.
Beginning with PLTS2020, LC lines can be drawn at the points where the Y-axis values are positive if the Y-axis unit is Ohms. Supported plot formats include Zr, Zi, |Z|, |Zi|. In addition, if Show LC Values is turned on, Log X-Axis and Log Y-Axis are automatically turned on. If Log X-Axis and Log Y-Axis are turned off, then Show LC Values is also turned off.
Right click in the plot then select Marker > Insert.
Right click in the plot then select Show
LC Values.
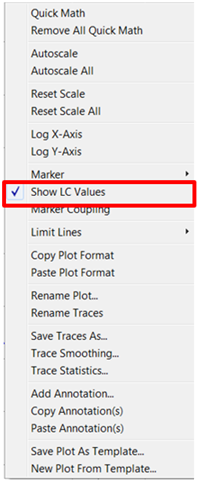
The LC values are shown in the marker.