S-Parameter/Transfer Function Viewer
You can view magnitude, phase, and group delay charts for up to eight S-parameter or transfer function files in the S-Parameter/Transfer Function Viewer.
To open the S-Parameter/Transfer Function Viewer dialog box:
-
Choose File > S-Parameter/Transfer Function Viewer....
-
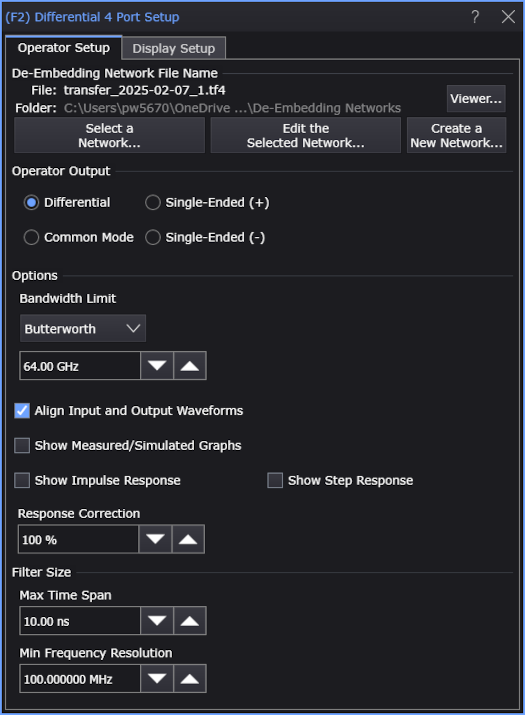
Or, click the Viewer... button in any of the Setup dialog boxes for the Apply s2p, Apply s4p, Remove s2p, Remove s4p, or 2 Port, 4 Port 1 Src, or 4 Port de-embedding simulation function operators. For example:
The S-Parameter/Transfer Function Viewer dialog box looks like:
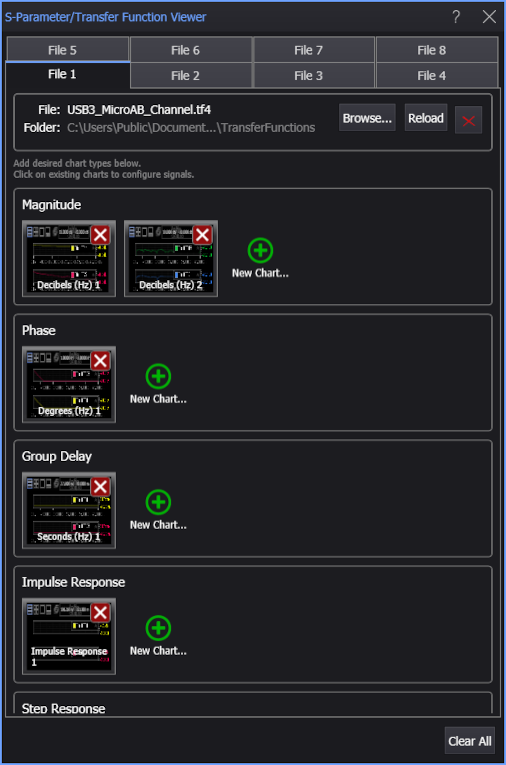
To load an S-parameter or transfer function file, select one of the eight File tabs, click Browse..., navigate and select the file you want to view, and then click Open.
The viewer supports files in the following formats:
- Touchstone 1 and Touchstone 2 files
- S-parameter memory
- Transfer function files (ATF version A.01.00 derived from the Touchstone 1.1 format)
You can click Reload to refresh a file that has changed in the file system.
You can click the red X button to clear a file.
To clear all files, click Clear All at the bottom of the dialog box.
When importing S-parameters or transfer functions from a file, the frequency spacing in the file must be uniform or the file will not be loaded. The frequency spacing used can differ between different imported files.
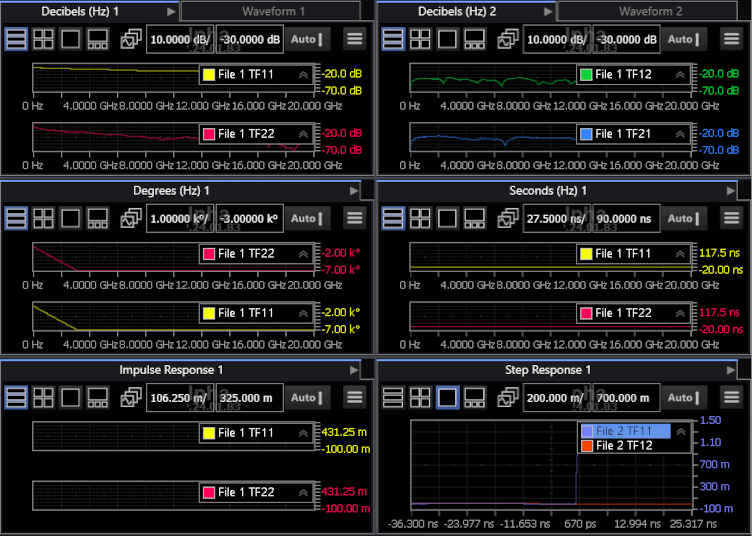
After the responses have been loaded from the file, you can click the green + New Chart... button to view them in Magnitude (Freq-Mag), Phase, Group Delay (GrpDelay), Impulse Response (available with transfer functions), and Step Response (available with transfer functions) charts (waveform content windows). Each chart can display multiple plots and up to four charts of each type can be displayed.
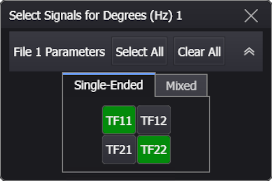
For example, to view TF11 and TF22 in a Phase chart, click + New Chart.... The Select Signals for Phase dialog box appears as shown in the following picture. All of the S-parameters in the file are shown as gray tiles. Click TF11 and TF22 to select those responses for the chart. The selected tiles turn a green color indicating that they are included on the chart.
Close the dialog boxes to view the waveforms.
Loaded S-parameter or transfer function files are not affected by performing a Default Setup (Setup > Default Setup) or by restarting Infiniium. However, any displayed charts will not be preserved. If you want to save your chart selections, save an Instrument Setup.