Measurement Histograms
Measurement histograms are generated from the statistical analysis of measurement results. Up to four measurement histograms can be displayed at a time. You can view a histogram of any measurement as long as it is active and its results are numeric.
A Measurement Histogram
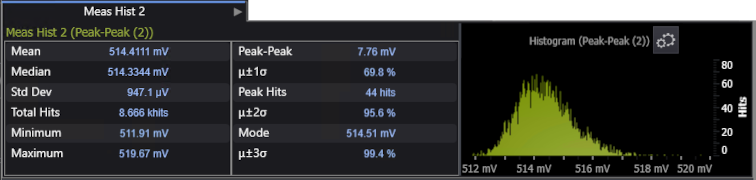
Although measurement results already have statistics, histograms give you a visual representation of the measurement results and they provide additional statistics (Peak-Peak, Mode, and others). You can control the resolution of histogram statistics by changing the number of bins used in the histogram.
When Measure One is selected for a measurement, the histogram acquires one scalar measurement result per acquisition. When Measure All is selected for a measurement, the histogram acquires N scalar measurement results per acquisition where N is the number of edges on which the measurement was made.
The measurement histogram database is reset when the Clear button is clicked or when the vertical scale, offset, horizontal position, horizontal scale, or trigger settings are changed.