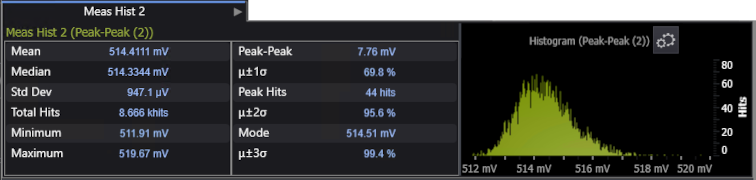
Measurement Histogram Results Panel
The statistical results of the measurement histogram are displayed in the Histogram table. While the display shows the most recent acquisitions only, the histogram database keeps track of all measurement results while the database is building.
| Label | Description |
|---|---|
| Mean | The average of the data set. |
| Std Dev | The standard deviation value of the data set. |
| Minimum | The bottom bound of the bin holding the smallest value in the data set. |
| Peak-Peak | The width of the histogram, that is, the difference between the maximum and minimum values. |
| Peak Hits | The number of results in the histogram's tallest bar. |
| Mode | The most common value in the data set. In other words, the value associated with the histogram's tallest bar. |
| Median | 50% of the measurement results are above the median and 50% are below the median. |
| Total Hits | The total number of results included in the histogram. |
| Maximum | The top bound of the bin holding the largest value in the data set. |
| μ ± 1σ | The percentage of results that are within ±1σ of the mean value. |
| μ ± 2σ | The percentage of results that are within ±2σ of the mean value. |
| μ ± 3σ | The percentage of results that are within ±3σ of the mean value. |
The setup (gears icon) button in the histogram chart opens the Measurement Histograms dialog box. See Measurement Histogram Configuration.
When more than one measurement histogram is set up, the results for each one will appear in its own tab/panel.