PAM Jitter
PAM-4 J3u, J4u, J5u, J6u, J8u, Jrms, and even-odd jitter (EOJ) measurements can be made on PRBS13Q, PRBS9Q, PCIe JnU, PCIe Dual-Dirac, and other data patterns. These measurements are based on the IEEE 802.3 bs and other standards for Output Jitter measurements.
The PAM-4 Jitter measurement algorithm calculates thresholds for each of the 12 edges used. (The defined PAM measurement thresholds are not used for these measurements, and would not be useful, because eyes are frequently closed.)
During these measurements, a jitter histogram is measured for each of 12 specific waveform transitions that are called out in the standard as well as for the combined effect of all edge transitions.
On PAM-4 signals that are derived from two NRZ signals, these measurements let you observe the effect of different uncorrelated jitter on each stream based on the transitioning bits.
To enable PAM-4 jitter measurements:
-
Specify the signal type as a PAM-4 signal (see Signal Type Setup).
-
Set up the appropriate clock recovery options for the input signal. See Clock Recovery.
-
Choose Measure > PAM Jitter....
-
In the PAM Jitter Measurement Setup dialog box, select the appropriate options; then, enable Perform PAM Jitter Analysis.
This enables the PAM Jitter content window.
Note that these measurements can be made up to 10,000 times, so they can take a long time to complete. Results are shown as "Incomplete" until the required number of measurements are made. To lower the Report Count from 10,000 to as few as 200 measurements, click the Setup button.
Results are shown as "n/a" when the measurement does not apply for the configuration. For example, EOJ for PAM-4 signals requires an odd pattern and some compliance patterns, like PCIe6, are even.
When the required number of measurements are made, the results are displayed.
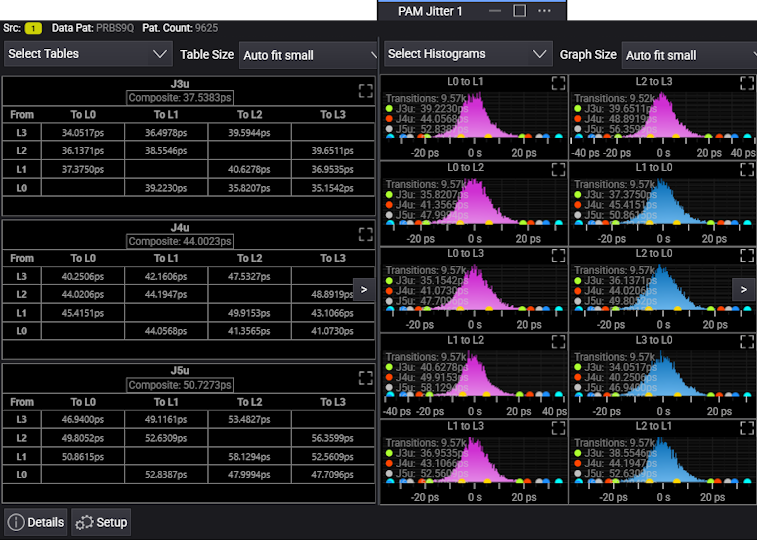
At the top of the PAM Jitter content window are controls for:
-
Select Tables — Specifies the tables that are displayed.
-
Table Size — Specifies how the selected tables should be displayed. You can select: Auto fit small size tables, Auto fit medium size tables, Auto fit large size tables, One graph, or in 1x2, 2x1, 2x2, 2x3, 3x2, or 3x3 grids. When there are more tables than will fit in the available space, arrows at the left and right let you navigate to the previous or next table(s).
-
Select Histograms — Specifies the histograms that are displayed.
-
Graph Size — Specifies how the selected histograms should be displayed. You can select: Auto fit small size graphs, Auto fit medium size graphs, Auto fit large size graphs, One graph, or in 1x2, 2x1, 2x2, 2x3, 3x2, or 3x3 grids. When there are more graphs than will fit in the available space, arrows at the left and right let you navigate to the previous or next graph(s).
When measuring jitter on the PCIe6 Dual-Dirac pattern, the PAM Jitter content window looks like this:
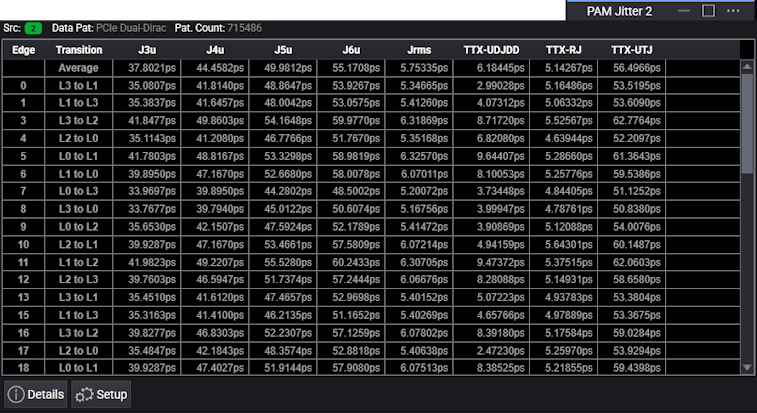
Jitter measurements on the PCIe6 Dual-Dirac pattern include Random Jitter RMS (TTX-RJ), and the dual-Dirac model is used to return Uncorrelated Total Jitter peak-peak (TTX-UTJ) and Uncorrelated Deterministic Jitter Delta-Delta (TTX-UDJDD) extrapolated to a BER of 1E-6. (J8u and EOJ measurements are not included.)
Jitter measurement results on the PCIe6 Dual-Dirac pattern are displayed in one table, and no histograms are displayed, so there are no controls for selecting or sizing tables or histograms.
At the bottom of the PAM Jitter content window are these controls:
-
Details — For the selected measurement in one of the tables, this button opens the Details dialog box that shows the status of the measurement, which can be "Correct", "Questionable", or "Invalid", and short explanations if the measurement is "Questionable" or "Invalid" (see Table of Measurement Messages). Click the Algorithm button to display a help topicwith more information on how the measurement is made.
-
Setup — Opens the PAM Jitter Measurement Setup dialog box where you can specify the PAM Jitter measurement options.
-