Follow these steps to start up the program.
Press Macro Setup.
Press Application.
Press Jitter.
The following screen appears.
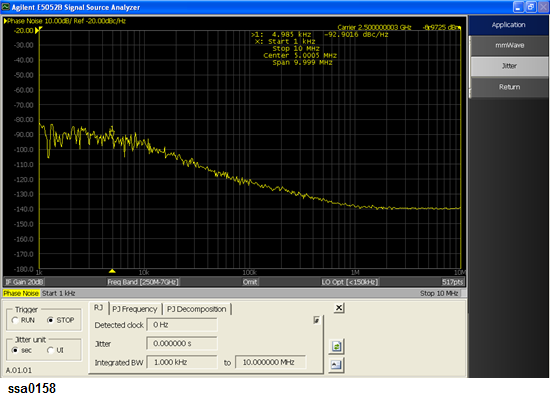
Initial screen for jitter analysis
It is required to push the button 9 in Screen for random jitter analysis to end the program.
After ending the program with this step, only the current window is active and other windows are inactive.
It is required to preset when you need to activate another windows.
This analysis displays the clock frequency and the rms value of random jitter in phase-noise measurement. You can use the band marker on the screen to specify an analysis range. In this case, the analysis range is also displayed.
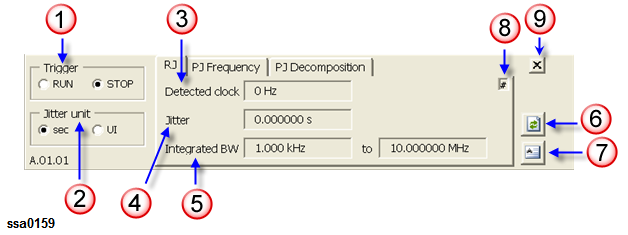
Screen for random jitter analysis
Select RJ from the analysis function selection tabs (default)
When you want to specify an analysis range, it is required to change the value of the integrated BW using either of the following two methods:
VBA interface: When you change the value using the VBA interface,the setting of Trigger should be "Stop" (1 in Screen for random jitter analysis)
Band Marker Function: When you change the value using the Band marker function, it is not required to fix the setting of trigger. It is available to set, Run or Stop (1 in Screen for random jitter analysis). For more information on band marker function,refer to Searching for Positions that Match Specified Criteria
Select a jitter display unit (2 in Screen for random jitter analysis).
|
Button |
Function |
|
sec |
Displays data in the unit of second. |
|
UI |
Displays data in the unit of unit interval. |
Select the RUN button (1 in Screen for random jitter analysis).
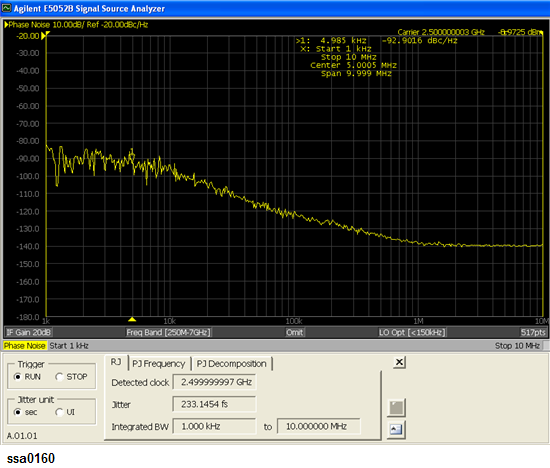
The measurement starts, and the clock frequency (3 in Screen for random jitter analysis) and the random jitter rms value (4 in Screen for random jitter analysis) are displayed.
Click the STOP button (1 in Screen for random jitter analysis) to finish the measurement.
From Firmware ver A.03.10,the maximum and minimum frequency (5 in Screen for random jitter analysis) can be set using VBA. This setting does not change even by changing tabs (i.e. From Frequency tab to Decomposition tab or vica-versa), but once exiting SSA-J, it is initialized.
Example of screen for random jitter analysis
You can save the analysis result to a file by following the steps below.
Click the tab of the analysis result that you want to save. At this time, analysis is carried out once.
Use the Save/Recall function to save the analysis result. For details, refer to File Saving and Loading Instrument Status Settings.
You can recall the analysis result from a file by following the steps below.
Use the Save/Recall function. For details, refer to File Saving and Loading Instrument Status Settings
Press the Refresh button (6 in Screen for random jitter analysis).
You can save the result of random jitter analysis to a text file by pressing the Export button (7 in Screen for random jitter analysis) .
Pressing the Export button opens the analysis result file in the Notepad application. Pressing this button during measurement writes the analysis result displayed at that time.
If you select another analysis function tab (PJ Frequency/PJ Decomposition) during measurement, the current measurement is aborted. In this case, the # sign (8 in Screen for random jitter analysis) is displayed for the analysis result to indicate a possible mismatch of displayed information between the E5052B and VBA.
Note that the # sign is not displayed if the E5052B’s displayed information is changed without using the VBA.
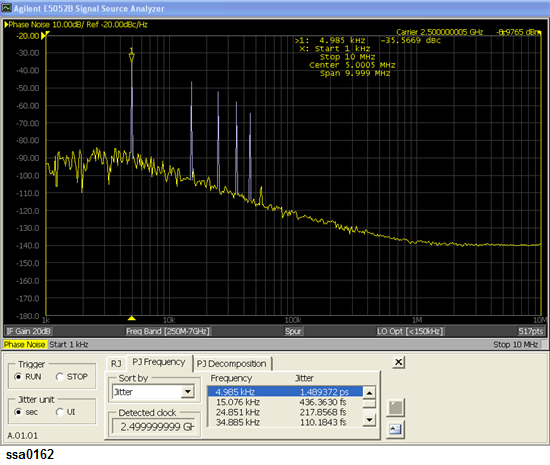
This analysis displays the clock frequency and the RMS value of the periodic jitter when the spurious power value display is enabled in phase-noise measurement. You can use the band marker on the screen to specify an analysis range.
Screen for periodic jitter frequency analysis
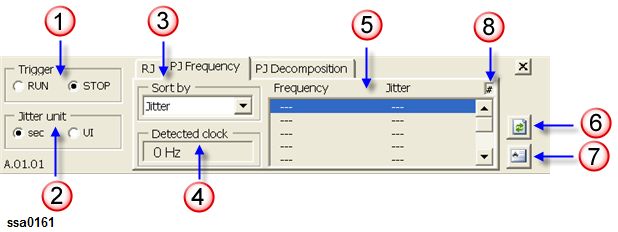
Select PJ Frequency from the analysis function selection tabs.
When you want to specify an analysis range, use the band marker on the phase-noise measurement screen.
Select a spurious sorting method displayed on the phase-noise measurement screen (3 in Screen for periodic jitter frequency analysis).
|
Button |
Function |
|
Jitter |
Sorts jitters in ascending order. |
|
Frequency |
Sorts frequencies in ascending order. |
Select a display unit (2 in Screen for periodic jitter frequency analysis).
|
Button |
Function |
|
sec |
Displays data in the unit of second. |
|
UI |
Displays data in the unit of unit interval. |
Select the RUN button (1 in Screen for periodic jitter frequency analysis).
The measurement starts, and the lists of clock frequencies (4 in Screen for periodic jitter frequency analysis) and periodic jitter rms values (5 in Screen for periodic jitter frequency analysis) are displayed.
Select the point you want to analyze from the list (5 in Screen for periodic jitter frequency analysis). When you select a point, the marker moves to the analysis point on the phase-noise measurement screen.
Click the STOP button to finish the measurement (1 in Screen for periodic jitter frequency analysis).
From Firmware ver A.03.10, all the frequencies of Frequency-Jitter list measured through PJ Frequency tab are displayed. Previously, only single frequency (displayed as blue) selected in the PJ Frequency tab was displayed.
Example screen of periodic jitter frequency analysis
You can save the analysis result to a file by following the steps below.
Click the tab of the analysis result that you want to save. At this time analysis is carried out once.
Use the Save/Recall function to save the analysis result. For details, refer to File Saving and Loading Instrument Status Settings.
You can recall the analysis result from a file by following the steps below.
Use the Save/Recall function. For details, refer to File Saving and Loading Instrument Status Settings.
Press the Refresh button (6 in Screen for random jitter analysis).
You can save the analysis result of random jitter analysis to a text file by pressing the Export button (7 in Screen for periodic jitter frequency analysis).
Pressing the Export button opens the analysis result file in the Notepad application. Pressing the Export button during measurement writes the analysis result displayed at that time.
If you select another analysis function tab (RJ/PJ Decomposition) during measurement, the current measurement is aborted. In this case, the # sign (8 in Screen for random jitter analysis) is displayed for the analysis result to indicate a possible mismatch of displayed information between the E5052B and VBA.
Note that the # sign is not displayed if the E5052B’s displayed information is changed without using the VBA.
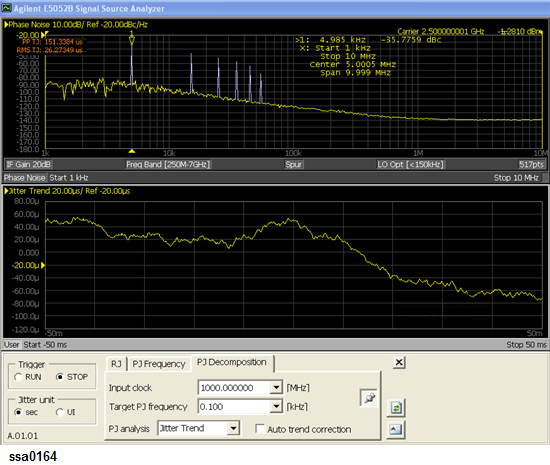
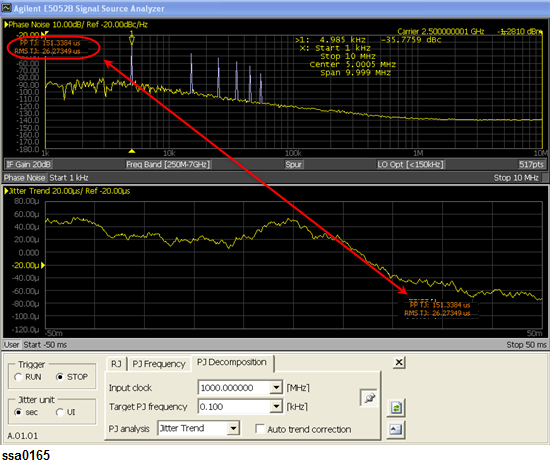
This analysis displays the jitter trend and histogram for jitter value analysis. The target frequency for transient measurement is linked.
Screen for periodic jitter decomposition analysis
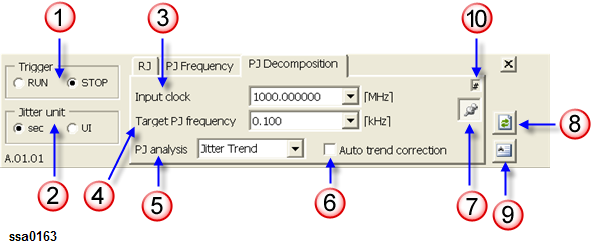
Select PJ Decomposition from the analysis function selection tabs.
Specify a clock frequency (MHz) for the periodic jitter frequency analysis (3 in Screen for periodic jitter decomposition analysis). Frequencies added here are saved in the list.
Enter the period jitter frequency you want to analyze (4 in Screen for periodic jitter decomposition analysis). Frequencies entered here are saved in the list of jitter values (5 in Screen for periodic jitter frequency analysis).
Select an analysis function (5 in Screen for periodic jitter decomposition analysis).
|
Button |
Function |
|
Jitter Trend |
Displays the jitter trend and analyzes the total jitter. |
|
Histogram |
Displays the histogram and analyzes the total jitter. |
|
PJ Separation |
Displays the histogram and Gaussian and analyzes the total jitter and periodic jitter. |
Turns on/off the jitter trend auto correction function (6 in Screen for periodic jitter decomposition analysis).
The average of the narrow band measurement frequencies used in transient measurement is set to the phase reference frequency offset value.
To turn on this function, select the Auto Trend Correction checkbox.
Select a display unit (2 in Screen for periodic jitter decomposition analysis).
|
Button |
Function |
|
sec |
Displays data in the unit of second. |
|
UI |
Displays data in the unit of unit interval. |
Select the RUN button (1 in Screen for periodic jitter decomposition analysis).
The previous analysis result is cleared.
Measurement starts, and the analysis result is displayed.
|
Button |
Function |
|
Jitter Trend |
|
|
Histogram |
|
|
PJ Separation |
|
If fitting fails, ? (question mark) is added at the end of the analysis result.
Click the STOP button to finish the measurement (1 in Screen for periodic jitter decomposition analysis).
Example screen for periodic jitter decomposition analysis
You can display the result of periodic jitter decomposition analysis at your desired position. Clicking the Adjust Position button (7 in Screen for periodic jitter decomposition analysis) will bring up another window on which you can adjust the display position as shown in the figure below.
You can save the analysis result to a file. Follow the steps below.
Click the tab of the analysis result that you want to save. At this time analysis is carried out once.
Use the Save/Recall function to save the analysis result. For details, refer to File Saving and Loading Instrument Status Settings.
You can recall the analysis result from a file by following the steps below.
Use the Save/Recall function. For details, refer to File Saving and Loading Instrument Status Settings.
Press the Refresh button (6 in Screen for random jitter analysis).
You can save the result of random jitter analysis to a text file by pressing the Export button (7 in Screen for periodic jitter decomposition analysis).
Pressing the Export button opens the analysis result file in the Notepad application. Pressing the Export button during measurement writes the analysis result displayed at that time.
If you select another analysis function tab (RJ/PJ Frequency) during measurement, the current measurement is aborted. In this case, the # sign (10 in Screen for random jitter analysis) is displayed for the analysis result to indicate a possible mismatch of displayed information between the E5052B and VBA.
Note that the # sign is not displayed if the E5052B’s displayed information is changed without using the VBA.
To install the program, you need to separately purchase the E5001A SSA-J option. After you purchase this, a license certificate is issued from Keysight Technologies.
Follow the instructions on the license certificate to access the Keysight Technologies license server and receive your license key code.
License key codes are managed based on the serial number of the E5052B. The license for a certain E5052B cannot be transferred to any other E5052B.
There are two types of E5001A licenses: permanent license and limited-time license, which have different methods for entering the license code. For more information, see Example of entering a permanent license key code or Example of entering a limited-time license key code.
Follow these steps to enable this function after receiving your license key code.
Press System.
Press the Service Menu button.
Press the Install Option License button.
Press the Jitter button.
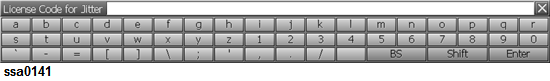
The screen below appears for entering the license key code (SIGN=xxxxxx). After entering it, press the Enter key. After installation, the Jitter button is enabled (on).
You can enter the license key code with the keyboard.
License key code entry screen
After entering the license code, the restart confirmation dialog box appears. Press Yes to restart the firmware.
For the following sample permanent license, enter “128E234EE8B0.”
FEATURE SSA-J Keysight 1.000 permanent uncounted \
HOSTID=VDH=E5052A_JP1KL00066 SIGN=128E234EE8B0
For the following sample limited-time license, enter “1-may-2006,1269EA605D7C.”
FEATURE SSA-J Keysight 1.000 1-may-2006 uncounted \
HOSTID=VDH=E5052A_JP1KL00066 START=1-apr-2006 \
SIGN=1269EA605D7C
You can confirm that the E5001 is installed by checking the following items.
The return value of the *OPT? command (should be “SSA-J”)
Options displayed according to Checking the Product Information
Options displayed at the startup of the E5052B
If an error occurs during clock jitter measurement, a dialog box appears and the measurement stops. You may encounter the following messages.
|
Option SSA-J not Installed. |
|
|
|
The E5001 (Option SSA-J) is not installed. |
|
Unexpected error. |
|
|
|
This message may be displayed on the periodic jitter decomposition analysis screen. It indicates that the trend range of the current measurement is greatly different from those of previous measurements and thus analysis cannot be performed. |
|
Trigger error. |
|
|
|
This message is displayed when the setting of the E5052B is changed during measurement and thus measurement cannot be triggered. |
|
No AgtJitter data on SSA. |
|
|
|
This message may be displayed on the periodic jitter frequency analysis screen and the periodic jitter decomposition analysis screen. It indicates that no measurement data exists when you try to save/recall. |
|
File write error. |
|
|
|
This message is displayed when writing to a file fails. |